Balanced Scorecard: Strategic Management Framework
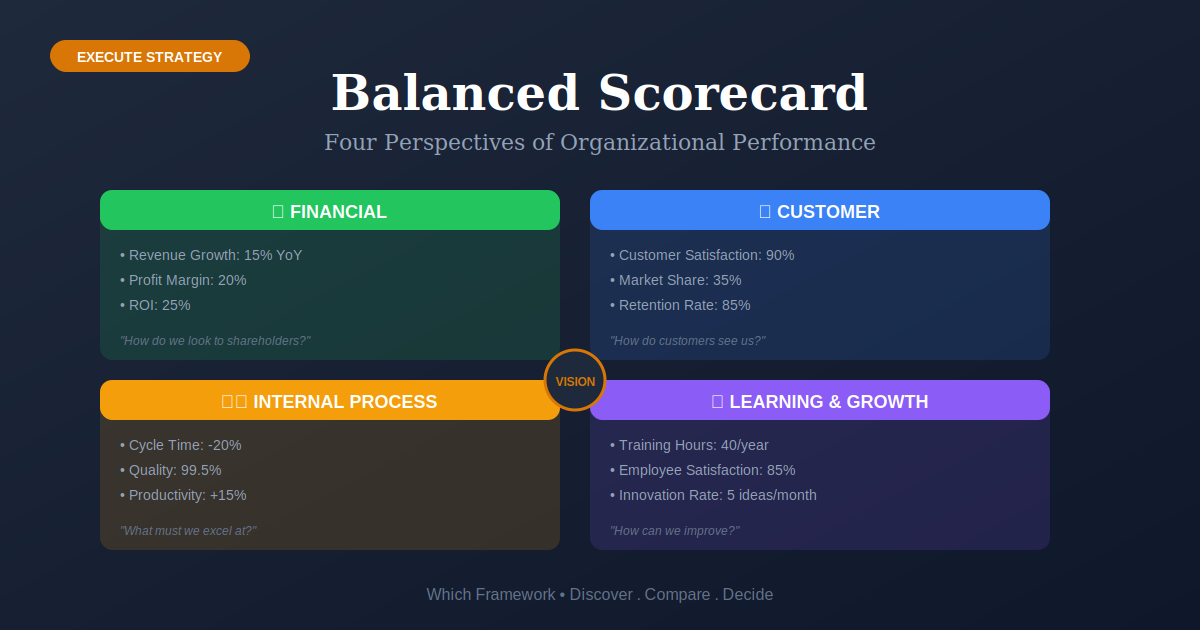
Balanced Scorecard translates organizational strategy into a comprehensive set of measurable objectives across four perspectives: Financial, Customer, Internal Process, and Learning & Growth—providing a balanced view of organizational health.
Before you start
Is the Balanced Scorecard your framework?
The Balanced Scorecard suits an organization that already has a strategy and cannot tell whether it is working, because everything being measured is financial and financial results arrive too late to steer by.
It is a translation device: strategy in, measures out. It will not tell you what your strategy should be, and it is heavy — a genuine scorecard takes months and requires executive sponsorship that survives the whole build.
| If your real problem is… | You probably want |
|---|---|
| We have not decided what the strategy is | SWOT, PESTEL or Five Forces first — the scorecard takes strategy as an input Compare all three |
| We need focus and momentum this quarter | OKR — lighter, faster cadence, far less machinery Compare Scorecard and OKR |
| We just need to pick the right measures | KPIs — a scorecard is a structure for KPIs, not a substitute for choosing them Not sure which? Compare |
| We have the measures and need to show them well | Dashboarding — presentation, not strategy translation |
| We need to show how objectives connect to each other | Strategy Map — Kaplan and Norton’s own later addition, and arguably the more useful half Compare with Strategy Map |
| Turning a chosen strategy into what teams actually do | The strategy execution playbook, where the balanced scorecard is stage 2 of 5 |
| Strategy exists, but only finance can tell if it is working | Balanced Scorecard — you are in the right place |
The distinction that matters
A scorecard is not a dashboard with four sections. The four perspectives exist to force a causal argument: that investing in people improves processes, which improves what customers experience, which eventually shows up in the numbers. If your four boxes contain measures that could each stand alone, you have built a report, not a scorecard.
What Is It?
The Balanced Scorecard, developed by Robert Kaplan and David Norton at Harvard Business School, is a strategic management framework that addresses the limitation of traditional financial-only performance measurement. It balances financial metrics with non-financial measures that drive long-term value creation.
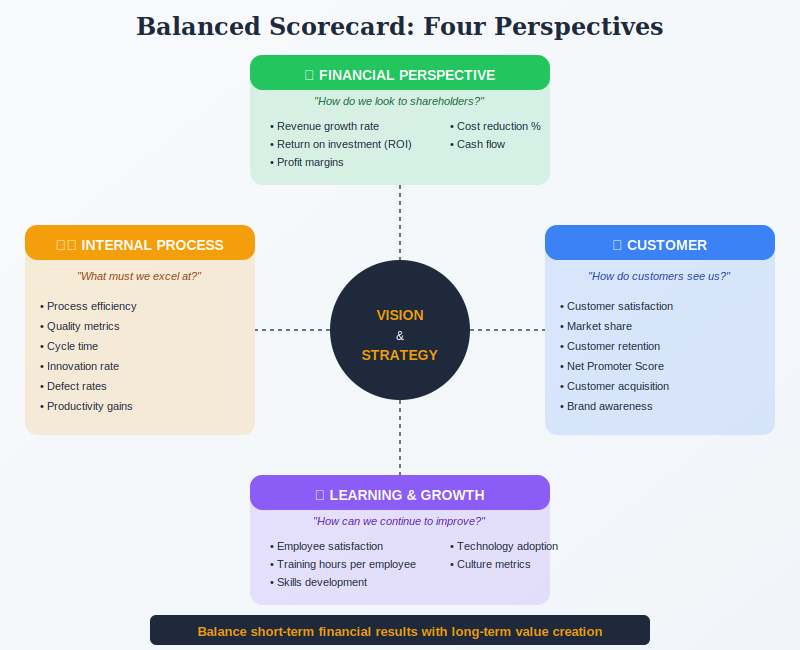
The framework organizes objectives and metrics across four perspectives: Financial (how we look to shareholders), Customer (how customers see us), Internal Process (what we must excel at), and Learning & Growth (how we can improve). Each perspective contains objectives, measures, targets, and initiatives.
The power of the Balanced Scorecard lies in showing how these perspectives are interconnected. Learning & Growth enables better Internal Processes, which drive Customer satisfaction, which ultimately delivers Financial results. This cause-and-effect chain helps organizations understand how to create long-term value.
Since its introduction in 1992, the Balanced Scorecard has evolved from a performance measurement tool to a comprehensive strategic management system used by organizations worldwide.
Quick Reference
The core structure
The four perspectives of the Balanced Scorecard
Kaplan and Norton proposed four perspectives, each answering a different question about the same strategy. They are conventionally drawn bottom-up, because that is the direction the argument is supposed to run.
| Perspective | The question it answers | Typical measures | Where it goes wrong |
|---|---|---|---|
| Financial | How do we look to shareholders? | Revenue growth, margin, return on capital, cash generation | Fills up first and crowds out the rest, because the data already exists. |
| Customer | How do customers see us? | Retention, acquisition cost, satisfaction, share of segment | Measures what is easy to survey rather than what drives the choice to buy. |
| Internal Business Process | What must we excel at? | Cycle time, quality, cost to serve, on-time delivery | Becomes an operations report covering every process rather than the few that carry the strategy. |
| Learning and Growth | Can we continue to improve and create value? | Skills coverage, retention, systems capability, culture | The one that decides whether the scorecard works, and the one most often filled with training-hours counts. Everything above it is supposed to follow from here. |
The direction of the argument
Read bottom to top: capable people build better processes, better processes produce a better customer experience, and that eventually shows in the financials. That chain is the entire point — and, as the evidence section below sets out, it is an assumption rather than a demonstrated fact. Treat your chain as a hypothesis you are testing, not a mechanism you have installed.
Core Features
- Financial Perspective: Revenue, profitability, ROI, shareholder value metrics
- Customer Perspective: Satisfaction, retention, market share, brand metrics
- Internal Process Perspective: Quality, cycle time, productivity, innovation metrics
- Learning & Growth Perspective: Employee skills, culture, technology, knowledge metrics
- Cause-and-Effect Linkages: Shows how perspectives drive each other
- Leading & Lagging Indicators: Balances predictive and outcome measures
- Strategic Initiatives: Links measures to action plans
Worked example
One strategy, translated into four perspectives
An illustrative composite. A 900-person specialist insurer whose strategy was to move from price competition to service differentiation. The first scorecard had twenty-eight measures and changed nothing. The second had eleven and worked.
The right column is the test: does this measure connect to the one above it? A measure that connects to nothing is a report line.
| Perspective | First attempt | What replaced it |
|---|---|---|
| Financial | Nine measures including three margin variants | Two: retention-driven revenue, and combined ratio. Everything else moved to the monthly finance pack, where it belonged. |
| Customer | “Customer satisfaction score” | Renewal rate by segment, and proportion of claims settled without a follow-up call. Both connect to what the strategy actually promised. |
| Internal Process | Eleven operational metrics | Three: first-contact resolution, claim cycle time, and proportion of cases needing escalation. |
| Learning & Growth | Training hours delivered | Proportion of handlers authorised to settle without referral, and eighteen-month retention of experienced staff. Training hours measured effort; authority to settle measured whether the capability existed. |
| The chain | Absent | More handlers empowered to settle → fewer escalations, faster cycle → fewer follow-up calls, higher renewals → retention-driven revenue. Four links, each testable. |
What actually changed
Twenty-eight measures became eleven, and the eleven were chosen because each one connected to the next. The Learning and Growth row did the most work: replacing training hours with authority to settle turned an input count into a capability measure, and it was the only change anyone in operations could feel.
If you can draw an arrow from each measure to one above it, you have a scorecard. If the four boxes are simply four categories of thing you already track, you have re-filed your existing reporting.
When to Use
- You need comprehensive strategy management beyond financial metrics
- Your organization is large and needs coordinated performance management
- You want to balance short-term results with long-term value creation
- You need to align operations with strategic objectives
- You're in a mature organization with established data collection
- Stakeholders need visibility into strategy execution (complementary to OKR)
- You work in enterprise, government, or nonprofit sectors
When NOT to Use
- You're a startup or small organization (too complex—consider OKR or Lean Strategy)
- You need quick decisions without extensive data collection
- Leadership isn't committed to comprehensive measurement
- You lack resources for ongoing data collection and analysis
- Your strategy changes frequently (Balanced Scorecard assumes stability)
In practice
How scorecards degrade
Balanced Scorecards rarely fail outright. They decay into performance reports, usually within a year, through a handful of recognizable steps.
| What you see | What it usually means | What to do |
|---|---|---|
| Twenty or more measures | Nothing was excluded, because excluding a measure means telling someone their work is not strategic | Cap it. Kaplan and Norton suggested roughly four to seven per perspective, and most working scorecards sit well below that. |
| The financial box is full, the learning box is thin | Measures were chosen by data availability rather than by strategy | Build the bottom perspective first. If Learning and Growth is weak, the causal chain has no starting point and the rest is reporting. |
| Measures that could each stand alone | Four categories were filled in rather than a chain constructed | Draw the arrows. Every measure should connect to one above it. Anything unconnected belongs in an operational report. |
| Learning and Growth is training hours | Effort is being counted instead of capability | Ask what someone can now do that they could not before. Authority granted, certifications held, systems adopted — not hours delivered. |
| It is reviewed quarterly and never changes anything | It became a reporting ritual rather than a control system | The review should test the causal chain: did the process measures move after the capability measures did? If not, the hypothesis is wrong and the scorecard is telling you so. |
| Nobody outside the executive team can name a measure | The scorecard was built and never cascaded | Kaplan and Norton’s later work is largely about this problem. A scorecard nobody below the board can recite cannot align anything. |
Sourced
What the evidence says
It started as a measurement fix, not a strategy system.
Kaplan and Norton’s 1992 Harvard Business Review article argued that relying on financial measures alone was like flying a plane on one instrument — results arrive after the decisions that caused them. The original proposal was a balanced set of measures. The strategic apparatus everyone now associates with the scorecard came later.
Kaplan, R. S. & Norton, D. P., “The Balanced Scorecard — Measures That Drive Performance”, Harvard Business Review 70, Jan–Feb 1992, pp. 71–79.
The version most people are taught is the one its authors moved on from.
The scorecard was substantially rebuilt three times. In 1996 it became a strategic management system rather than a measurement set, in the book subtitled Translating Strategy into Action. In 2000 The Strategy-Focused Organization addressed cascading and alignment. In 2004 Strategy Maps added the diagram that makes the causal chain explicit — arguably the more useful half of the whole method. Most summaries, and most corporate implementations, still teach the 1992 four-boxes version, which is exactly the one that degenerates into a dashboard.
Kaplan & Norton, The Balanced Scorecard: Translating Strategy into Action (1996); The Strategy-Focused Organization (2000); Strategy Maps (2004).
The causal chain is asserted, not demonstrated.
This is the most serious academic objection and it is rarely mentioned in practitioner guides. Hanne Nørreklit argued in 2000 that the relationships between the four perspectives are presented as cause and effect but are really logical relations — true by definition rather than established by evidence — and that no empirical validation was offered. She also noted the model largely ignores external factors such as competitors and technology, and that the time lags between perspectives are unaddressed: improvements in capability may show up in financial results years later, or never.
Nørreklit, H., “The balance on the balanced scorecard — a critical analysis of some of its assumptions”, Management Accounting Research 11(1), 2000, pp. 65–88; and “The Balanced Scorecard: what is the score?”, Accounting, Organizations and Society 28(6), 2003.
What that means for using it.
Treat your causal chain as a hypothesis you are testing, not a mechanism you have installed. That single reframing survives the critique and makes the scorecard more useful, not less: the quarterly review becomes an examination of whether capability gains actually moved process measures, and whether those moved customer measures. When a link fails to hold, you have learned something about your strategy. When the review only asks whether each number went up, you have a report with four headings.
Key Strengths
- Comprehensive View: Balances multiple dimensions of performance
- Strategy Translation: Converts abstract strategy into concrete measures
- Cause-and-Effect: Shows how actions lead to outcomes
- Long-term Focus: Balances short-term financial with long-term capability
- Proven Track Record: Decades of successful implementation across industries
Key Weaknesses
- Complex to implement correctly—requires significant investment
- Data-intensive—needs robust measurement systems
- Can become bureaucratic if not managed carefully
- Requires executive alignment and commitment
- May oversimplify complex strategic relationships
How It Works
| 1 Primary Input | Organizational vision, strategy, and current performance data |
|---|---|
| 2 Data You Need | Financial metrics, customer data, process measurements, employee surveys |
| 3 Primary Output | Scorecard with objectives, measures, targets, and initiatives across four perspectives |
Comparison with Related Frameworks
Balanced Scorecard is a comprehensive strategy management tool. Here's how it compares:
Balanced Scorecard vs OKR
OKR is simpler, focusing on objectives and key results without the four-perspective structure. BSC is more comprehensive but complex. Use OKR for goal alignment; BSC for holistic strategy management.
Balanced Scorecard vs Strategy Map
Strategy Map was developed by Kaplan & Norton as a companion to BSC. The Strategy Map visualizes cause-and-effect relationships; BSC provides the measurement system. They're often used together.
Balanced Scorecard vs Hoshin Kanri
Hoshin Kanri is the Japanese approach with similar comprehensive goals but more emphasis on cascading deployment. BSC focuses on four perspectives; Hoshin on breakthrough objectives. Both can work in large organizations.
Sequencing
What to run before and after
The scorecard translates a strategy into measures. It cannot produce the strategy, and it does not by itself make anyone act on the measures.
Before
Have a strategy worth measuring
A scorecard built on a vague strategy produces vague measures with real authority behind them, which is worse than no scorecard. If you cannot say what you are choosing not to do, you are not ready.
During
Map the chain, then measure it
Draw the causal links before choosing measures — that is what a strategy map is for, and doing it in this order prevents the scorecard filling up with whatever data already exists.
After
Cascade it, or it stays on the top floor
A scorecard nobody below the executive team can recite aligns nothing. Something has to carry it into team-level commitments and an operating rhythm.
Part of a playbook: How to Execute a Business Strategy. The balanced scorecard is stage 2 of 5, after the strategy map and before McKinsey 7S.
Common questions
Balanced Scorecard: quick answers
What are the four perspectives of the Balanced Scorecard?
Financial (how do we look to shareholders), Customer (how do customers see us), Internal Business Process (what must we excel at), and Learning and Growth (can we continue to improve and create value). They are read bottom-up: capable people build better processes, which produce a better customer experience, which eventually shows in the financials.
Who developed the Balanced Scorecard?
Robert S. Kaplan and David P. Norton, in a Harvard Business Review article published in January–February 1992. They developed it substantially afterwards — into a strategic management system in 1996, cascading and alignment in 2000, and strategy maps in 2004.
How does the Balanced Scorecard translate strategy into action?
By requiring each strategic objective to be expressed as a measure with a target and an initiative, within one of the four perspectives, and connected to a measure above it. The connection is the part that matters: the scorecard makes an explicit claim that improving capability improves process, which improves customer outcomes, which improves financial results.
What is the difference between a Balanced Scorecard and OKR?
Scale and cadence. A scorecard is a comprehensive measurement architecture covering the whole organization, typically reviewed quarterly and rebuilt rarely. OKR is a lighter goal-setting rhythm, usually quarterly and deliberately focused on a few things. Scorecards suit larger organizations that need a stable measurement structure; OKRs suit faster-moving ones that need focus.
What is the difference between a Balanced Scorecard and a strategy map?
A strategy map is the diagram showing how objectives cause one another across the four perspectives. The scorecard is the accompanying set of measures, targets and initiatives. Kaplan and Norton added strategy maps in 2004, and the map is arguably the more useful half — it is where the causal argument becomes visible and testable.
What are the main criticisms of the Balanced Scorecard?
The most serious is that its causal chain is asserted rather than demonstrated. Hanne Nørreklit argued in 2000 that the links between perspectives are logical relations rather than empirically validated cause and effect, that time lags between them are unaddressed, and that external factors like competitors and technology are largely absent. In practice the commonest failure is simpler: the scorecard becomes a report with four headings and twenty-plus disconnected measures.
Deep Resources
Frameworks related to Balanced Scorecard
- OKR (Objectives & Key Results)Goal-setting methodology that defines ambitious Objectives and measurable Key Results to…
- Strategy MapVisual representation of strategy showing how objectives connect through cause-and-effect…
- Hoshin Kanri (Policy Deployment)Japanese strategic planning methodology that cascades breakthrough objectives through the…