Resource Allocation Matrix: Team Resource Optimization
Resource Allocation Matrix visualizes team member assignments across projects as percentages, identifying overallocation (burnout risk) and underutilization (wasted capacity) to optimize workforce deployment.
What Is It?
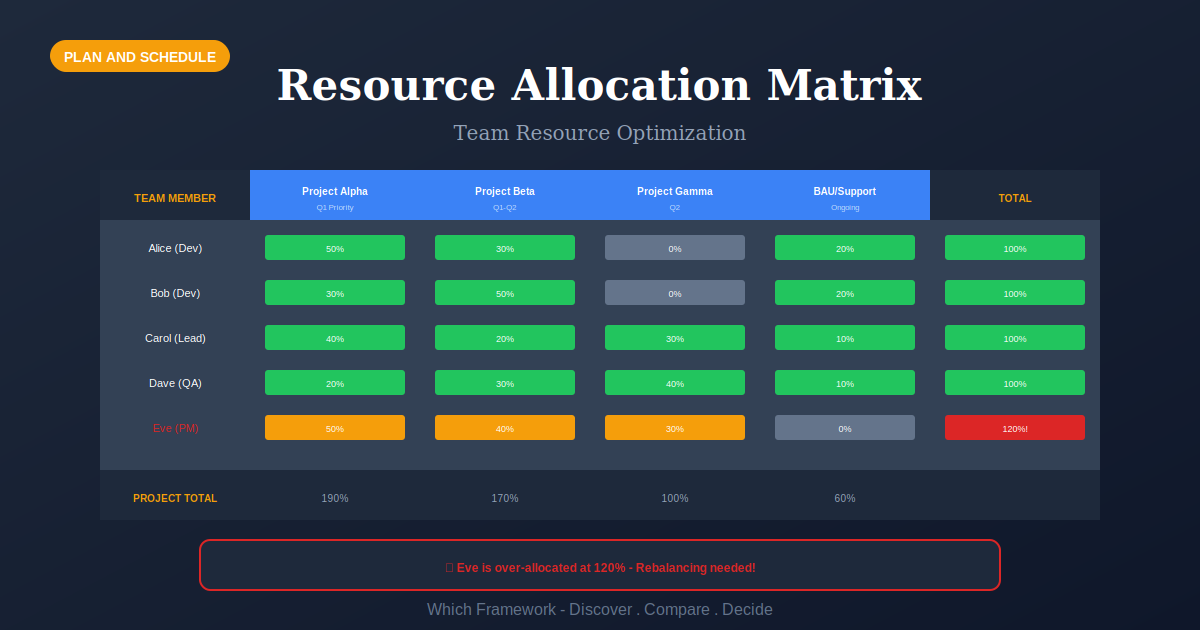
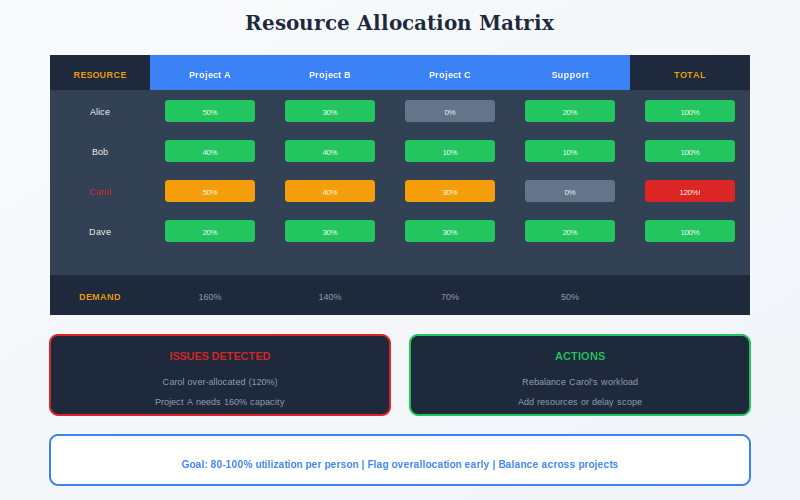
The Resource Allocation Matrix shows who is working on what and for how much of their time. Team members are rows, projects are columns, and cells contain allocation percentages. Each row should sum to 100% (or less) to prevent overallocation.
When someone exceeds 100%, they're overallocated—a leading indicator of burnout and missed deadlines. When project demand exceeds available capacity, you need to add resources, reduce scope, or extend timelines.
This framework connects to WBS for understanding work requirements, Gantt Charts for timing, and RACI Matrix for responsibility clarity.
Quick Reference
Core Features
- Percentage Allocation: Clear view of time commitment per project
- Overallocation Detection: Highlight when totals exceed 100%
- Underutilization Visibility: Identify spare capacity for new work
- Skill Matching: Align capabilities with project needs
- Temporal View: Track allocation over time periods
- Demand vs. Supply: Compare project needs to available capacity
When to Use
- Managing multiple concurrent projects
- Staffing and capacity planning decisions
- Preventing team burnout proactively
- Project portfolio management
- New project intake decisions
- Resource leveling across projects
- Identifying hiring needs
When NOT to Use
- Single-project environments
- Very small teams (1-2 people)
- Highly variable work that resists planning
- When allocation tracking overhead isn't justified
- Organizations without project-based work
Key Strengths
- Visibility: Clear picture of resource deployment
- Early Warning: Identifies overallocation before burnout
- Decision Support: Data for capacity-based decisions
- Communication: Objective basis for resource discussions
- Optimization: Find and deploy underutilized capacity
Key Weaknesses
- Requires accurate time tracking or estimation
- Can become outdated quickly without maintenance
- Doesn't capture skill nuances automatically
- May feel like micromanagement to some teams
- Overhead to maintain for large organizations
How It Works
| 1 Primary Input | Team roster, project list, estimated effort per project per person |
|---|---|
| 2 Data You Need | Person availability, project requirements, time period for planning |
| 3 Primary Output | Allocation percentages, overallocation alerts, capacity gaps, utilization metrics |
Comparison with Related Frameworks
Resource Allocation Matrix vs RACI Matrix
RACI defines who is Responsible/Accountable/Consulted/Informed. Resource Allocation shows how much time each person spends. Use RACI for role clarity; Resource Allocation for capacity planning.
Resource Allocation Matrix vs Gantt Chart
Gantt Charts show when tasks happen over time. Resource Allocation shows who has capacity for those tasks. Use both together—Gantt for scheduling, Resource Allocation for staffing.