
BCG Growth-Share Matrix: Portfolio Strategy Framework
BCG Growth-Share Matrix is a portfolio management framework that categorizes business units or products into four quadrants—Stars, Cash Cows, Question Marks, and Dogs—based on market growth rate and relative market share to guide resource allocation decisions.
Before you start
Is the BCG Matrix your framework?
The growth-share matrix answers one question: across the businesses or products you already own, where should cash go and where should it come from? It is a portfolio allocation tool, and it assumes you have a portfolio — several distinct units with their own markets and market shares.
It was built for the diversified conglomerate. If you run one product in one market, there is nothing to allocate between and the matrix has no work to do.
| If your real problem is… | You probably want |
|---|---|
| Which direction should we grow in? | Ansoff Matrix — forward-looking growth options, not the portfolio you already hold Compare BCG and Ansoff |
| Is this market structurally worth being in? | Porter’s Five Forces — market growth rate is a crude proxy for attractiveness Not sure which? Compare |
| Why is this unit winning or losing? | VRIO — the matrix records position and never explains it Not sure which? Compare |
| How do we escape a low-share, low-growth position? | Blue Ocean Strategy — rejects the premise that you must fight for share in the existing market |
| How do we track whether the plan is working? | Balanced Scorecard or OKR Not sure which? Compare |
| We hold several units and must allocate cash across them | BCG — you are in the right place |
The load-bearing assumption
The whole matrix rests on one claim: that high relative market share causes superior returns, via scale and the experience curve. If that does not hold in your industry — and in premium, niche or fragmented markets it often does not — then the quadrants are describing your position without telling you anything about what to do. Test the assumption before trusting the prescription.
What Is It?
The BCG Growth-Share Matrix, developed by Bruce Henderson at Boston Consulting Group in 1968, is one of the most influential strategic planning tools ever created. It helps organizations manage their portfolio of business units or products by plotting them on a 2x2 matrix based on market growth rate and relative market share.
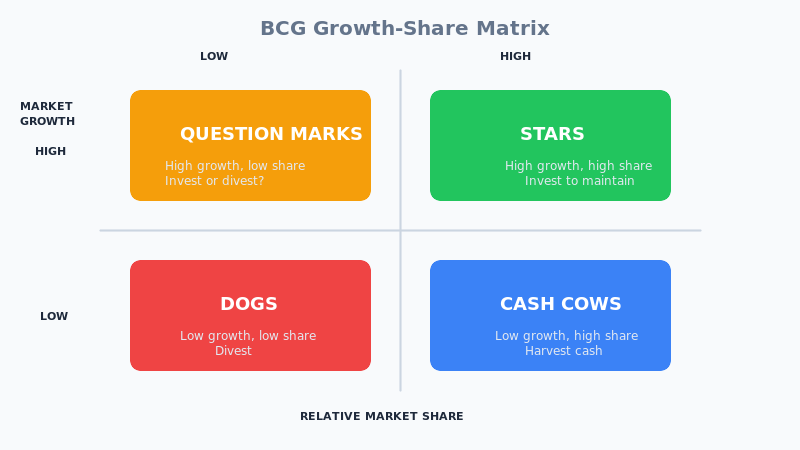
The framework produces four distinct categories: Stars (high growth, high share) are market leaders in growing markets requiring investment to maintain position. Cash Cows (low growth, high share) generate excess cash in mature markets. Question Marks (high growth, low share) require decisions about whether to invest or divest. Dogs (low growth, low share) typically should be divested.
The underlying logic is the experience curve—higher market share leads to lower costs through accumulated experience. Cash generated by Cash Cows should fund Stars and promising Question Marks, creating a balanced portfolio that ensures both current profits and future growth.
The BCG Matrix complements Ansoff Matrix for growth strategy, Porter's Five Forces for competitive analysis, and SWOT Analysis for strategic assessment.
Quick Reference
The core mechanics
The two axes, and the one everyone plots wrong
Two measures place every unit. One is straightforward. The other is misread more often than any other number in strategy teaching.
| Axis | Formula | Dividing line | What it stands for |
|---|---|---|---|
| Relative market share (horizontal) | Your market share ÷ largest competitor’s market share | 1.0× — above it you are the market leader, below it you are not | Competitive strength, on the argument that scale drives down unit cost via the experience curve |
| Market growth rate (vertical) | (This year’s market size − last year’s) ÷ last year’s | Commonly 10%, though it should be set against your industry’s norm | Market attractiveness, and how much cash the unit will need to keep pace |
Relative market share is a ratio, not a percentage. If you hold 20% of a market and the leader holds 40%, your relative market share is 0.5× — not 20%. If you hold 30% and the nearest rival holds 15%, it is 2.0×. The axis is conventionally logarithmic and centered on 1.0, so the question it asks is simply: are you the leader, and by how much?
Plotting absolute percentages instead puts almost every unit on the low-share side of the grid, which is why so many student and workshop matrices end up with nothing but question marks and dogs.
The four quadrants that follow
Star — high share, high growth. Self-funding at best; invest to hold position.
Cash Cow — high share, low growth. Generates the cash that funds everything else. Harvest, do not starve.
Question Mark — low share, high growth. The only genuinely hard decision on the grid: fund it hard enough to reach leadership, or exit. Half-funding is the expensive middle.
Dog — low share, low growth. Divest or hold for cash, but check first whether it is actually unprofitable or merely unfashionable.
Core Features
- 2x2 Matrix Structure: Simple visual representation of portfolio
- Four Quadrants: Stars, Cash Cows, Question Marks, Dogs
- Market Growth Rate: Vertical axis measuring industry attractiveness
- Relative Market Share: Horizontal axis measuring competitive position
- Resource Allocation: Guides investment and divestment decisions
- Portfolio Balance: Ensures mix of growth and cash generation
Worked example
Plotting four units, with the arithmetic
An illustrative composite. A Minneapolis household products company with four business units, allocating next year’s investment budget. Relative market share is computed against the largest competitor in each unit’s own market.
Note unit C. Its absolute share is the second highest of the four, and it still lands in the weakest quadrant — because the leader in its market is more than twice its size.
| Unit | Our share | Leader’s share | RMS | Market growth | Quadrant |
|---|---|---|---|---|---|
| A — Cleaning sprays | 34% | 34% (us) | 34 ÷ 21 = 1.6× | 14% | Star — fund to hold leadership |
| B — Laundry additives | 29% | 29% (us) | 29 ÷ 18 = 1.6× | 3% | Cash Cow — the funding source |
| C — Air care | 31% | 68% | 31 ÷ 68 = 0.46× | 2% | Dog — despite the second-highest absolute share |
| D — Eco refills | 8% | 25% | 8 ÷ 25 = 0.32× | 22% | Question Mark — commit or exit |
What the arithmetic exposed
Unit C was the finding. On absolute share it looked like the second-strongest business in the portfolio and had been funded accordingly for years. On relative share it is less than half the size of a dominant leader in a market growing at 2% — a position from which the experience-curve logic says it will never earn leadership economics.
Unit D is the real decision. Question marks are where the matrix stops describing and starts demanding a choice: fund it hard enough to reach 1.0× or get out. The expensive answer, and the common one, is to fund it enough to keep it alive and never enough to win.
When to Use
- Annual strategic planning and portfolio review
- Resource allocation across business units
- M&A target evaluation and due diligence
- Product line rationalization decisions
- Investment prioritization across divisions
- Communicating strategy to board and investors
- Identifying businesses to grow, maintain, or divest
When NOT to Use
- Single-product or early-stage companies
- When synergies between units are critical
- Industries where market share doesn't correlate with profitability
- Rapidly disrupting markets where historical data misleads
- Detailed operational or tactical decisions
In practice
How the BCG Matrix gets misused
Four boxes, two numbers, and a great deal of room to be confidently wrong.
| What you see | What it usually means | What to do |
|---|---|---|
| Almost everything is a question mark or a dog | Absolute market share was plotted instead of relative | Divide by the largest competitor’s share. The axis midpoint is 1.0×, meaning you are the leader — not 50% of the market. |
| The market was defined to make you look good | Narrowing the market until you are the leader | Define the market by where buyers actually substitute, and hold that definition constant across units. This is the easiest number on the grid to quietly game. |
| Dogs are divested automatically | The label was mistaken for the analysis | Check profitability and cash generation first. A dog throwing off steady cash with no reinvestment need is a perfectly good business, and it may share costs or customers with a unit you are keeping. |
| Cash cows are starved to fund stars | Harvest was read as neglect | Cash cows lose share when underfunded, and a cash cow that slips below 1.0× becomes a dog. Maintain the position that generates the cash. |
| Question marks are all funded a little | The hard choice was avoided | Question marks demand commitment or exit. Spreading the budget across all of them guarantees none reaches leadership and all consume cash. |
| Units are treated as independent | The matrix has no concept of synergy | Before divesting, ask which other units share customers, channels, brand or fixed costs with this one. The grid cannot see any of that. |
Sourced
What the evidence says
Henderson popularized it; he did not draw it first.
The matrix emerged as a collaborative effort inside the Boston Consulting Group between roughly 1968 and 1970. Alan Zakon sketched the first version, which was then refined with colleagues. Bruce Henderson, BCG’s founder, set out the concept in a 1970 essay titled “The Product Portfolio” in BCG’s Perspectives series, and it is his name that stuck. The common statement that Henderson invented it compresses a team effort into a single author.
Henderson, B. D., “The Product Portfolio”, BCG Perspectives No. 66, Boston Consulting Group, 1970.
At its peak it ran roughly half the Fortune 500.
In the late 1970s and early 1980s the growth-share matrix, or planning approaches built on it, was used by an estimated half of all Fortune 500 companies. Very few management tools have ever achieved that penetration, and it explains why the vocabulary — stars, cash cows, question marks, dogs — escaped strategy departments and entered ordinary business speech.
Estimate cited in Haspeslagh, P. C., “Portfolio Planning: Uses and Limits”, Harvard Business Review, January 1982.
BCG itself revisited it in 2014, and did not simply reaffirm it.
Reeves, Moose and Venema published “BCG Classics Revisited: The Growth Share Matrix”, concluding that the framework remains useful but requires enhancement. Their reasoning is specific: since 1970 conglomerates have become less common, the pace of change has accelerated, and competitive advantage has become less durable — which weakens the premise that a leadership position, once won, can be held long enough to earn back the investment. They also note that the importance of market share itself has diminished. This is the framework’s own house saying the load-bearing assumption has weakened.
Reeves, M., Moose, S. & Venema, T., “BCG Classics Revisited: The Growth Share Matrix”, Boston Consulting Group, 2014.
What that means for using it.
Use it as a structured way to see a portfolio and force cash-allocation conversations that would otherwise happen unit by unit, where every unit argues it needs more. That value is real and does not depend on the experience curve holding. What you should not do is take the quadrant prescriptions as instructions: divest the dogs, harvest the cows. Those follow from an assumption about share and returns that its own authors now describe as weakened, and that was never true in premium or fragmented markets anyway. The grid is a map, and the recommendations printed on it are from 1970.
Key Strengths
- Simplicity: Easy to understand and communicate
- Visual Impact: Clear portfolio visualization
- Resource Focus: Forces allocation decisions
- Widely Known: Common language across organizations
- Strategic Perspective: Big-picture portfolio view
Key Weaknesses
- Oversimplifies to just two dimensions
- Market share doesn't always equal profitability
- Ignores synergies between business units
- Arbitrary cutoff between high and low
- Static snapshot of dynamic markets
How It Works
| 1 Primary Input | Business unit revenue, market share data, industry growth rates |
|---|---|
| 2 Data You Need | Market size, competitor market shares, industry growth forecasts, unit profitability |
| 3 Primary Output | Portfolio map, investment priorities, divestment candidates, resource allocation plan |
Comparison with Related Frameworks
BCG Matrix vs Ansoff Matrix
Ansoff Matrix focuses on growth direction (products vs markets). BCG Matrix evaluates existing portfolio. Use Ansoff to identify growth paths, BCG to allocate resources across current businesses.
BCG Matrix vs Porter's Five Forces
Porter's Five Forces analyzes industry attractiveness. BCG Matrix positions businesses within industries. Use Five Forces for industry analysis, BCG for portfolio decisions.
Sequencing
What to run before and after
The matrix plots positions. It does not establish whether the markets are worth being in, why you hold the position you do, or what to do next.
Before
Define the markets honestly
Every number on the grid depends on where you draw the market boundary, and it is the easiest thing to quietly narrow until you are the leader. Settle it before anyone computes a share.
During
Plot, then explain
The grid says where each unit sits; it never says why. A unit at 0.4× may be structurally disadvantaged or simply badly run, and the response differs entirely.
After
Turn allocation into commitments
A portfolio decision that does not change budgets, targets and reporting is a diagram. Question marks in particular need an explicit funding threshold and an exit trigger.
Common questions
BCG Matrix: quick answers
What are the four quadrants of the BCG Matrix?
Stars (high relative share, high growth) — invest to hold leadership. Cash Cows (high share, low growth) — harvest the cash that funds the rest. Question Marks (low share, high growth) — commit heavily or exit. Dogs (low share, low growth) — divest or hold for cash, after checking whether they are genuinely unprofitable.
How do you calculate relative market share in the BCG Matrix?
Divide your market share by the largest competitor's market share. It is a ratio, not a percentage: 20% share against a leader on 40% gives 0.5×; 30% against a rival on 15% gives 2.0×. The axis midpoint is 1.0×, meaning you are the leader. Plotting absolute percentages instead is the single most common error and pushes almost every unit into the question mark and dog quadrants.
Who created the BCG Growth-Share Matrix?
It came out of the Boston Consulting Group between roughly 1968 and 1970. Alan Zakon sketched the first version and refined it with colleagues; BCG founder Bruce D. Henderson set out the concept in a 1970 essay, “The Product Portfolio”, in BCG's Perspectives series. Henderson is usually credited alone, which compresses a team effort into one name.
What is the difference between the BCG Matrix and the Ansoff Matrix?
The BCG Matrix looks at the portfolio you already own and asks where cash should go. The Ansoff Matrix looks forward at growth you have not attempted and asks which direction carries least risk. BCG classifies existing units; Ansoff chooses between future moves. They are often taught together and pair naturally in that order.
Is the BCG Matrix still relevant?
Partly, and BCG itself has said so. In 2014 Reeves, Moose and Venema revisited the framework and concluded it remains useful but needs enhancement, because conglomerates are less common, change has accelerated, and competitive advantage is less durable than in 1970 — all of which weaken the premise that market leadership reliably produces superior returns. Use it to structure portfolio conversations; treat the quadrant prescriptions with more caution.
Should you always divest a dog?
No. Dog is a position on a grid, not a verdict on a business. Check whether the unit is actually unprofitable, whether it generates steady cash without needing reinvestment, and whether it shares customers, channels, brand or fixed costs with units you are keeping. The matrix has no concept of synergy and cannot see any of that.
Deep Resources
Frameworks related to BCG Growth-Share Matrix
- Ansoff MatrixGrowth strategy framework with four options: Market Penetration, Product Development, Market…
- Porter's Five ForcesRigorous industry analysis framework examining five competitive forces to determine industry…
- SWOT AnalysisClassic strategic framework assessing Strengths, Weaknesses, Opportunities, and Threats for…