Ansoff Matrix: Growth Strategy Framework
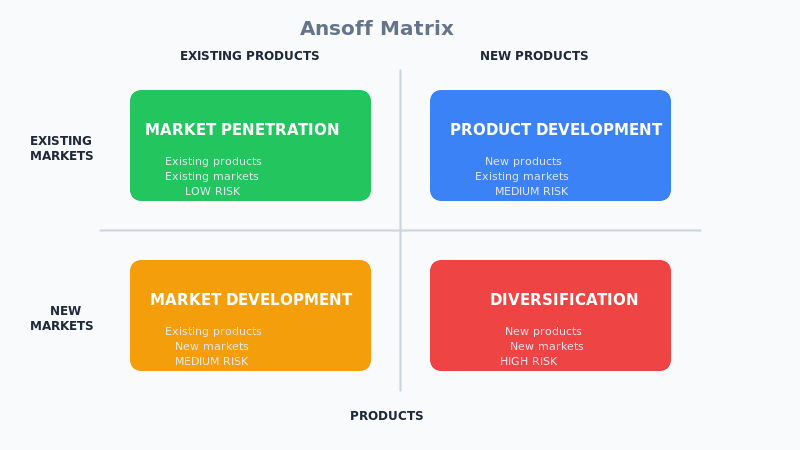
Ansoff Matrix is a growth strategy framework presenting four strategic options based on product-market combinations: Market Penetration, Product Development, Market Development, and Diversification, arranged by increasing risk.
What Is It?
The Ansoff Matrix, created by Igor Ansoff in his seminal 1957 Harvard Business Review article "Strategies for Diversification," is one of the oldest and most widely used strategic planning frameworks. It helps organizations systematically evaluate growth options by examining the intersection of products (existing vs. new) and markets (existing vs. new).
The framework identifies four distinct growth strategies: Market Penetration (existing products, existing markets)—the safest path, focusing on increasing market share. Product Development (new products, existing markets)—creating new offerings for current customers. Market Development (existing products, new markets)—finding new customer segments or geographies. Diversification (new products, new markets)—the riskiest strategy, entering entirely new businesses.
Risk increases diagonally across the matrix—Market Penetration is lowest risk because you know both your products and customers, while Diversification is highest risk because both are unfamiliar. This risk gradient helps organizations match growth ambitions with risk tolerance.
The Ansoff Matrix pairs well with BCG Matrix for portfolio decisions, SWOT Analysis for capability assessment, and Porter's Five Forces for market analysis.
Quick Reference
Core Features
- 2x2 Matrix: Products (existing/new) × Markets (existing/new)
- Market Penetration: Grow share with current products in current markets
- Product Development: New products for existing customers
- Market Development: Existing products for new markets
- Diversification: New products for new markets (related or unrelated)
- Risk Gradient: Clear visualization of increasing risk
When to Use
- Strategic planning sessions for growth direction
- Evaluating expansion opportunities
- New market entry decisions
- Product portfolio planning
- M&A target assessment
- Annual planning and resource allocation
- Communicating growth strategy to stakeholders
When NOT to Use
- Detailed implementation planning (too high-level)
- Operational decisions
- When defending market position (focus on competition)
- Cost reduction or efficiency initiatives
- Crisis management situations
Key Strengths
- Simplicity: Easy to understand and apply
- Visual Clarity: Clear options and trade-offs
- Risk Communication: Intuitive risk gradient
- Universal Application: Works across industries
- Fast Decision Support: Quick strategic alignment
Key Weaknesses
- Oversimplifies complex growth decisions
- Doesn't address competitive dynamics
- No guidance on execution complexity
- Binary product/market classification can be unclear
- Ignores resource and capability requirements
How It Works
| 1 Primary Input | Current product portfolio, market definition, growth objectives |
|---|---|
| 2 Data You Need | Market size estimates, competitor analysis, capability assessment |
| 3 Primary Output | Growth strategy selection, risk-adjusted priorities, expansion roadmap |
Comparison with Related Frameworks
Ansoff Matrix vs BCG Matrix
BCG Matrix evaluates existing portfolio performance. Ansoff Matrix identifies growth directions. Use BCG to assess what you have, Ansoff to decide where to grow.
Ansoff Matrix vs Blue Ocean Strategy
Blue Ocean Strategy creates uncontested market space. Ansoff focuses on product-market combinations within competitive context. Blue Ocean transcends the matrix by creating new demand.