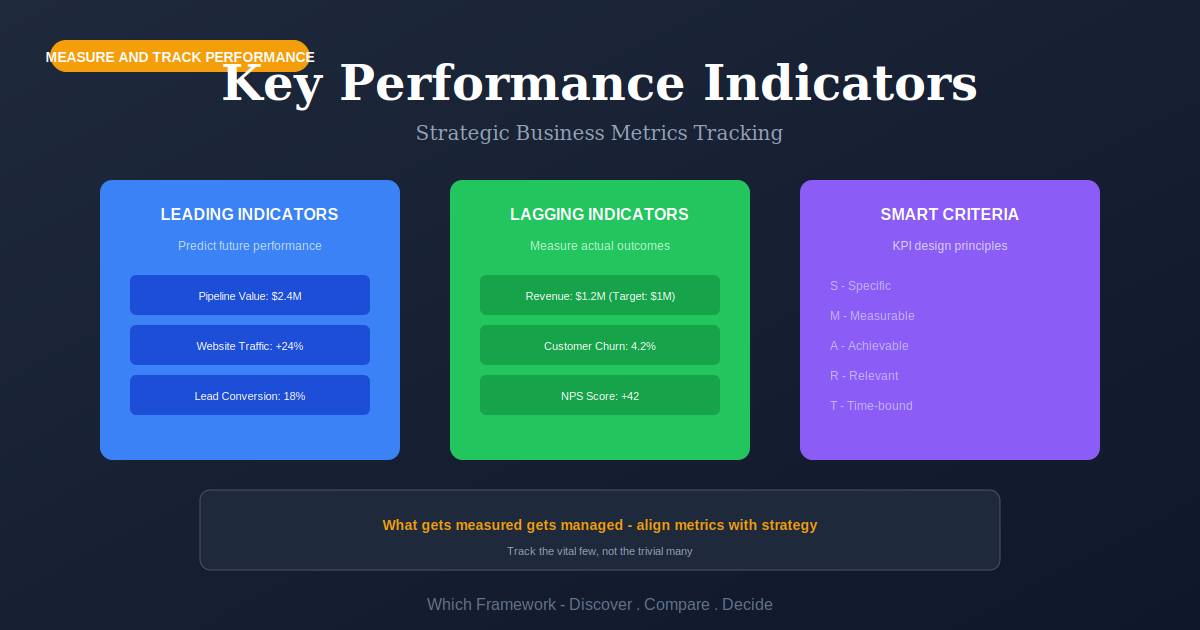
KPI Frameworks: Which One to Use, and Why Most KPIs Are Not KPIs
Key Performance Indicators are measures tied to objectives and tracked against targets, and are one of four types of performance measure, alongside key result indicators, result indicators and performance indicators.
Before you start
Is this your framework?
This page is about choosing and defining measures: which ones to track, what each one has to specify, and what happens to them once people know they are being watched.
It is not a goal-setting method and not a reporting tool. If the problem is that nobody agrees what the organization is trying to achieve, measures will not settle it, and the table below says what will.
| If your real problem is… | You probably want |
|---|---|
| We need measures spread across more than the financial picture | Balanced Scorecard — four perspectives that force customer, process and learning measures alongside financial ones Compare KPIs and Balanced Scorecard |
| We need ambitious quarterly goals, not standing health measures | OKR — an objective with key results, set on a cycle, deliberately harder than business as usual Compare KPIs and OKR |
| We cannot explain how our measures connect to the strategy | Strategy Map — the cause-and-effect chain that has to exist before measures mean anything |
| We have the measures and the problem is that nobody looks at them | Dashboarding and Visualization — presentation and reporting cadence rather than measure selection |
| We need to reduce variation and defects in a specific process | Six Sigma Metrics — statistical process measures, a different discipline from management reporting |
| We are choosing what to build and need it ranked | RICE — prioritization scoring, which measures options rather than performance |
| We have too many numbers, no owners, and no idea which ones matter | Key Performance Indicators — you are in the right place |
What Is It?
A key performance indicator is a measure someone has decided is critical, tied to an objective, given a target, and made somebody's responsibility. The last part is what separates it from the rest of the reporting pack. A number with no owner is a fact; a number with an owner is an indicator.
In practice almost everything called a KPI fails that test. Dashboards fill with counts that are true, easy to compute, and connected to no decision anyone makes. The discipline is subtraction, not addition — and subtraction is politically harder, because every measure on the dashboard was put there by somebody.
The second thing that makes this harder than it looks is that measures change behavior. Once people know a number is being watched, effort moves toward the number. Sometimes that is the point. Often it means effort moves toward the number and away from the thing the number stood for. The two come apart quietly. The dashboard keeps improving while the business does not.
So a measurement system has to answer three questions, and most answer only the first: what do we track, who acts on it, and how would we notice if the measure had stopped reflecting reality?
Quick Reference
The distinction
Four types of measure, only one of them key
David Parmenter's central argument is that lumping every measure together as a KPI is the reason measurement programs fail. He separates result indicators, which sum up what several teams produced between them, from performance indicators, which trace back to one team that can be held to them. Each splits again into an ordinary and a key version, giving the four in the table below.
| Type | What it tells you | Who it is for |
|---|---|---|
| Key result indicator KRI | How the organization did overall, across a period. Net profit, customer satisfaction, return on capital. | The board. Useful for judging direction, useless for fixing anything, because no single team owns it. |
| Result indicator RI | What was produced, summed across teams. Yesterday's sales, weekly output, cash collected. | Management. Tells you the score without telling you who moved it. |
| Performance indicator PI | What one identifiable team did. Late deliveries per depot, calls resolved first time by shift. | The team itself, and its manager. Actionable because ownership is unambiguous. |
| Key performance indicator KPI | The few measures that move everything else. Reported daily or weekly, non-financial, traceable to a team, and pointing at an action. | Everyone, including the chief executive. Parmenter reckons most organizations have fewer than ten and can name none of them. |
Why the sorting is worth the afternoon it costs
The practical test is not academic. Take any measure on your dashboard and ask two questions. Can one named team change it this week? If not, it is a result indicator. Holding a team to it is unfair as well as useless. If it moved the wrong way this morning, would anyone know what to do before lunch? If not, it is not key, whatever it is called.
Two of Parmenter's other observations earn their place. KPIs are almost never expressed in money, because money is the summed consequence of what people did rather than a thing anyone does. And the moment a KPI enters a bonus scheme it stops behaving like a measure. His phrase for what it becomes is a key political indicator.
Choosing a system
What people mean by a KPI framework
Asking for a KPI framework can mean at least four different things, and they sit at different layers rather than competing. One picks the measures, one sets the goals, one writes each measure down, one displays the result. Choosing between them as if they were alternatives is the usual way a measurement program gets stuck.
| System | What it decides | What it leaves open |
|---|---|---|
| Balanced Scorecard | Which areas get measured, by forcing coverage across financial, customer, internal process, and learning and growth | Which specific measures, and whether any of them is actionable. It is a coverage check, not a selection method. |
| Parmenter's winning KPI method | Which measures qualify as key, via critical success factors, the four types and the 10/80/10 mix | What your objectives are in the first place. It assumes you already know what success looks like. |
| OKR | What to push on this quarter, and what achieving it would look like | Ongoing health. OKRs are for change; KPIs are for the things that must not slip while you change them. |
| SMART criteria | How a single objective or measure is written down, including who owns it | Whether it was worth measuring. SMART will happily produce a perfectly specified pointless target. |
| Strategy Map | The cause-and-effect chain between measures, so leading and lagging have meaning | Thresholds, owners and reporting cadence. |
| Dashboards | How measures are presented and how often | Everything about which measures deserve to be there. |
The combination that works, and the one that does not
A workable stack goes in order. Pick the areas, sort the measures, write each one down with an owner, then display them. Scorecard or strategy map, then Parmenter's sorting, then SMART on each definition, then a dashboard. Skipping straight to the dashboard is how organizations end up with forty-seven numbers and no decisions.
The combination to avoid is running KPIs and OKRs as one list. A health measure you expect to hold and a stretch goal you expect to miss mean opposite things when they go red. Merge them and a red square stops telling you anything.
What a KPI Definition Has to Contain
A measure is not defined until all six of these are written down. Most dashboard entries have the first two.
- The metric: what is counted, and the exact calculation, including what is excluded
- The data source: which system it comes from, and who can check it
- The baseline: where it stands now, so movement means something
- The target and threshold: what good looks like, and at what point somebody acts
- The frequency: how often it is reported, matched to how fast it can actually move
- The owner: one named person who can change it and answers for it
Worked example
Forty-seven measures, four of them key
An illustrative composite. A last-mile delivery operator in Warsaw, Poland, running eleven depots. The executive dashboard carried 47 measures, all of them labeled KPIs. Deliveries were slipping and the dashboard was green. The measures were sorted using the four types and then re-tested against the two practical questions.
| Stage | What it showed |
|---|---|
| The sort | Of 47 measures, 31 were result indicators summed across depots with no single owner. Twelve were performance indicators. Four passed the test for key, and only one of those was reported often enough to act on. |
| The headline number was wrong | On-time delivery stood at 94.2%. Depot staff were marking parcels delivered on scan-out rather than on handover, which protected the number without moving a parcel. Nobody had instructed this; the measure had simply been in the bonus calculation for two years. |
| The measure nobody watched | Parcels still undelivered after a second attempt was tracked but buried. It could not be gamed at the depot, moved daily, and predicted the complaint volume three days out. |
| What the dashboard cost | Compiling the 47 measures took about 340 analyst hours a quarter across the depots and head office — roughly zł122,000 a year in staff time to produce numbers that changed no decisions. |
| What changed | Cut to nine measures, each with one named owner and a written calculation. On-time was redefined as customer-confirmed handover and removed from the bonus scheme. Second-attempt failures became the daily measure for depot managers. |
The most useful thing that happened was a number getting worse
Under the corrected definition, on-time delivery reported 87.6% instead of 94.2%. Nothing about the actual service changed that week. The 6.6 points were measurement error that had been accumulating since the measure entered the bonus calculation, and the board had been reading it as performance.
Two things are worth separating here. The sorting exercise found the problem, and it was cheap. But the fix was removing the measure from the bonus scheme, which was not a measurement decision at all. A dashboard cannot correct an incentive that is paying people to distort it, and no amount of redefining the metric would have held while the money pointed the other way.
When to Use
- Objectives exist and are stable enough to measure against
- The reporting pack has grown and nobody can say which numbers matter
- Teams need something they can be held to that they can actually move
- A recurring problem needs an early warning rather than a post-mortem
- Handing over an area and needing the health of it visible
- Before automating reporting, so you automate the right things
When NOT to Use
- The objectives themselves are contested; measures will not settle that argument
- Exploratory or research work, where the outcome worth having is not known yet
- The data is unreliable and there is no plan to fix it first
- The measure would be trivially gameable and is tied to pay
- Judging individuals on work that depends on other people's inputs
- Very early startups, where the thing worth measuring changes monthly
In practice
How measurement goes wrong
The first three below are about choosing badly. The rest are about what measures do to people once chosen, which is the half that gets left out of most guidance.
| Failure mode | What it looks like | What to do instead |
|---|---|---|
| Everything is a KPI | Forty measures on one dashboard, all labeled key, none acted on | Sort by type. Keep what a named team can move this week and act on before lunch. |
| Measuring what is easy | The system exports it, so it gets tracked, whether or not it relates to anything | Start from the objective and work back. If the needed measure does not exist, that is a finding. |
| No owner | A number reported monthly that belongs to a function rather than a person | One name per measure. If nobody will take it, it is a result indicator. |
| Tied to pay | The measure improves, the underlying thing does not, and nobody can say when they diverged | Keep KPIs out of bonus formulas. Judge people on the work; use measures to see the system. |
| The definition drifts | A number improves after a reporting change that nobody recorded as a change | Version the calculation. Any redefinition resets the baseline and is annotated on the chart. |
| Lagging only | Every measure reports what already happened, so problems are visible after they cost something | For each lagging measure, name the thing that moves first and check it is reported sooner. |
| Frequency mismatch | A monthly report on something that changes hourly, or daily reporting of an annual outcome | Match cadence to how fast the measure can genuinely move and to the decision it feeds. |
Sourced
Evidence, and how to cite it
The four types and the 10/80/10 mix are Parmenter's.
Parmenter separated performance measures into four kinds and gave each a name. He then proposed a mix: about ten key result indicators, up to eighty result and performance indicators, and about ten key performance indicators. He also lists seven characteristics a measure needs to count as key. Among them, that it is non-financial, that it is measured often, and that one team can act on it. The work draws on his research across organizations from the 1990s onward.
Parmenter, D. (2015) Key Performance Indicators: Developing, Implementing, and Using Winning KPIs. 3rd edn. Hoboken: Wiley.
SMART does not mean what it is usually said to mean.
George Doran's 965-word article in the November 1981 Management Review gave the acronym as Specific, Measurable, Assignable, Realistic and Time-related. Assignable meant naming who would do it. The circulating version substitutes Achievable and Relevant, which quietly drops the ownership requirement and leaves two criteria meaning much the same thing. Doran also noted that objectives cannot always be quantified, particularly in middle management — a caveat that almost never survives into the KPI templates that cite him.
Doran, G.T. (1981) ‘There’s a S.M.A.R.T. way to write management’s goals and objectives’, Management Review, 70(11), pp. 35–36.
Targets get gamed, and this has been documented rather than merely asserted.
Bevan and Hood examined England's public health targets through the 2000s. The reported gains were real. So was the gaming: effort moved toward measured activity and away from the rest, and reporting practices bent to meet thresholds. Their central point is that a target is a part standing in for a whole. The gap between the two is where the behavior goes. The paper has been cited well over a thousand times and is still the standard reference.
Bevan, G. and Hood, C. (2006) ‘What’s measured is what matters: targets and gaming in the English public health care system’, Public Administration, 84(3), pp. 517–538.
The line everyone quotes about measures and targets is not Goodhart's.
Goodhart's 1975 paper was about monetary aggregates. His own formulation was that a statistical regularity tends to break down once it is used for control. The compact version, when a measure becomes a target, it ceases to be a good measure
, was written by the anthropologist Marilyn Strathern in 1997. It comes from an essay on university auditing, where she credits the principle to Goodhart by way of Hoskin. Campbell had made a related argument about social indicators in 1979. Worth getting right if you are citing it.
Goodhart, C.A.E. (1975) Problems of Monetary Management: The UK Experience; Strathern, M. (1997) ‘Improving ratings: audit in the British University system’, European Review, 5(3), pp. 305–321.
There is no comparable evidence that having KPIs improves performance.
The literature on measurement is heavily weighted toward documenting what goes wrong. Studies of gaming, distortion and displacement are numerous and well identified. Controlled evidence that firms adopting a formal KPI system outperform those that do not is thin. It is also confounded, because firms able to run one differ in many other ways. None of this is an argument against measuring. It is a reason to treat a measurement program as a tool that supports decisions, with known failure modes, rather than as a proven intervention.
Assessment of the management literature as of 2026; no controlled outcome studies of KPI adoption are available.
How to cite it.
Harvard: Parmenter, D. (2015) Key Performance Indicators: Developing, Implementing, and Using Winning KPIs. 3rd edn. Hoboken: Wiley.
APA: Parmenter, D. (2015). Key performance indicators: Developing, implementing, and using winning KPIs (3rd ed.). Wiley.
For SMART, cite Doran (1981) in Management Review 70(11). For gaming, cite Bevan and Hood (2006) in Public Administration 84(3). For the measure-becomes-a-target line, cite Strathern (1997), not Goodhart.
Key Strengths
- Makes expectations explicit: a target and an owner leave less room for later argument
- Early warning: the right leading measure surfaces a problem while it is still cheap
- Forces subtraction: sorting by type is the only reliable way to shrink a reporting pack
- Transfers well: a measure with a written calculation survives a change of manager
- Cheap to run once chosen: the cost is in selection, not in reporting
Key Weaknesses
- Changes the behavior it measures: the central problem, and not fixable by better metrics
- Rewards the measurable: work that resists counting quietly loses priority
- Depends on data quality: a wrong number confidently reported is worse than none
- Drifts silently: definitions change and baselines rarely get reset
- Proliferates: adding a measure is easy and removing one is political
Sequencing
What to run before and after
Measures are downstream of objectives and upstream of reporting. Getting the order wrong is the most common reason a measurement program produces a dashboard nobody uses.
Before
Establish what you are trying to achieve, and how it connects
Measures are meaningless without an objective and a stated cause-and-effect chain. Without the chain, leading and lagging are just labels, and nobody can say why a given number was chosen.
During
Sort the measures and assign each one an owner
Separate result indicators from performance indicators, keep what a named team can move, and write down the calculation. Ownership is the step most often skipped and the one that determines whether anything happens.
After
Report them, and watch for the measure coming apart from reality
Set the cadence, then schedule a review of the definitions themselves. The question is not only how the numbers moved but whether they still mean what they meant when you chose them.
Common questions
KPIs: quick answers
What is a KPI?
A measure chosen to track progress toward an objective, with a stated target, a baseline to compare against, a reporting frequency and a named owner. Miss any of those and you have a number on a dashboard rather than an indicator. The narrow definition is stricter still: a KPI tells somebody what to do differently today.
What is a KPI framework?
People mean one of several different things. Sometimes a system for choosing which measures to track, such as the Balanced Scorecard or Parmenter's method. Sometimes a goal-setting structure the measures hang off, such as OKR. Sometimes just a template for writing a measure down. The comparison table on this page separates them, because picking the wrong one is the usual reason a measurement program stalls.
What is the difference between a KPI and a metric?
Every KPI is a metric; almost no metric is a KPI. A metric is anything you can count. A KPI is a metric someone has decided is critical, attached to an objective, given a target and an owner. An organization might track hundreds of metrics and have fewer than a dozen genuine KPIs.
How many KPIs should an organization have?
Parmenter's guide is a mix of roughly a hundred measures in total: about ten key result indicators for the board, up to eighty result and performance indicators for teams, and about ten key performance indicators. At team level, five to eight measures is the usual practical ceiling. Beyond that nobody acts on any of them.
What is the difference between leading and lagging indicators?
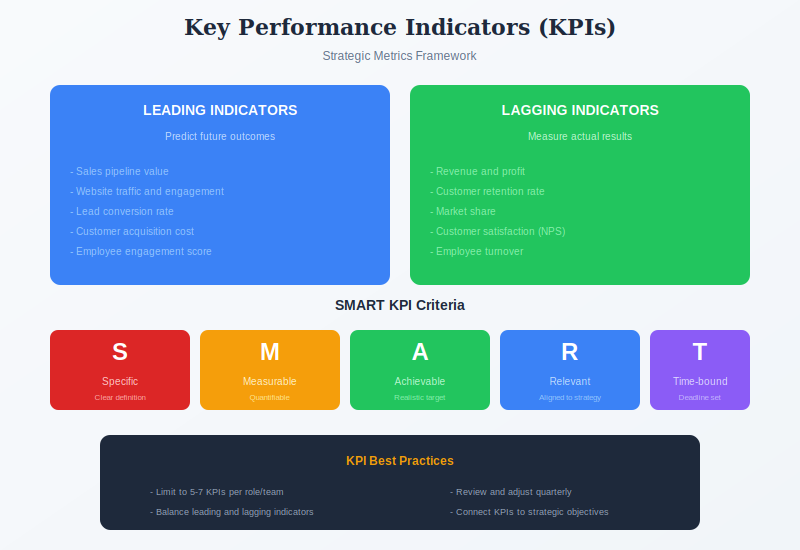
Lagging indicators report what already happened: revenue, churn, defects. Leading indicators are meant to predict it: pipeline coverage, engagement, backlog age. The split is useful but less clean than it sounds, because whether a measure leads or lags depends on what you are predicting. Treat it as a question about each measure rather than a fixed label.
What does SMART actually stand for?
In Doran's 1981 original: Specific, Measurable, Assignable, Realistic and Time-related. Assignable means naming who will do it. The version in wide circulation substitutes Achievable and Relevant, which loses the ownership requirement and duplicates Realistic. Doran also noted that not every objective can sensibly be quantified, a caveat that rarely survives the retelling.
What is the difference between KPIs and OKRs?
OKRs are a goal-setting cycle: an ambitious objective with a few key results that define what achieving it looks like, usually set quarterly and often deliberately not fully attainable. KPIs are ongoing health measures with targets you expect to hold. Most organizations need both, and get into trouble by converting standing KPIs into quarterly OKRs or tying either to pay.
How do you cite KPI sources?
For the four types of measure and the 10/80/10 mix, cite Parmenter, D. (2015) Key Performance Indicators, 3rd edn, Wiley. For SMART, cite Doran, G.T. (1981) in Management Review 70(11). For evidence on target gaming, cite Bevan and Hood (2006) in Public Administration. The line about a measure ceasing to be a good measure is Strathern (1997), not Goodhart.
Deep Resources
Frameworks related to Key Performance Indicators
- Balanced ScorecardFour perspectives that decide which areas get measured before you pick the measures…
- OKRQuarterly stretch goals, which behave differently from standing health measures…
- Dashboarding and VisualizationHow the measures get presented once you have decided which ones deserve to be there…