Playbook
How to Execute a Business Strategy
Five questions, asked in order, for a strategy that has to leave the slide.
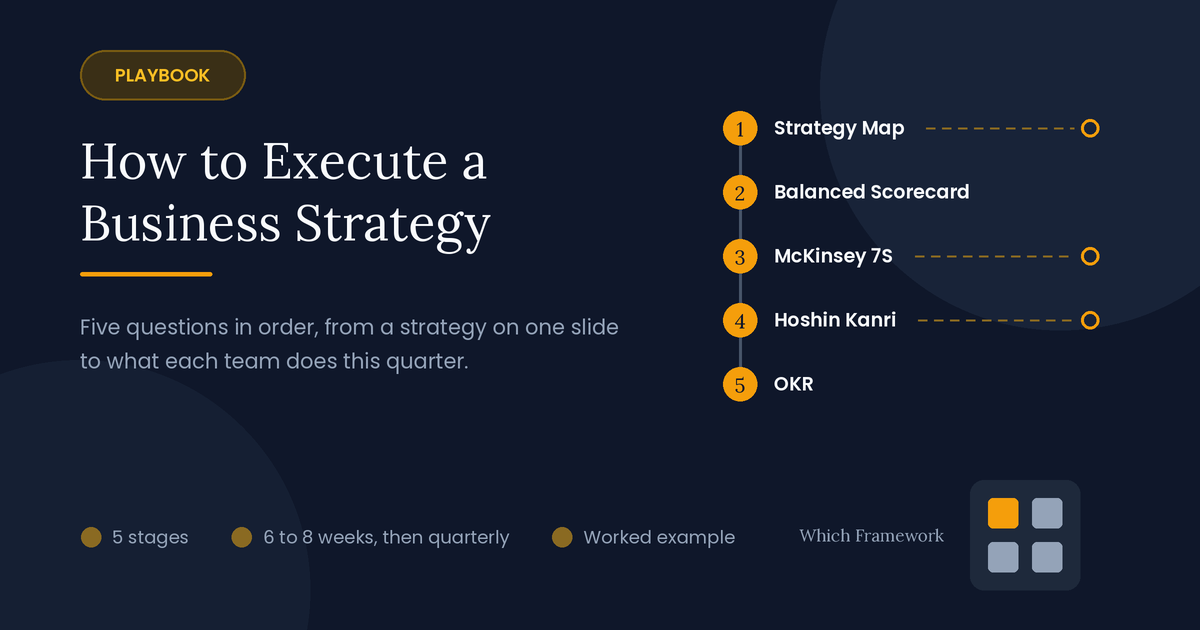
A strategy execution playbook is a five-stage sequence of management tools that turns a chosen strategy into measured objectives, an aligned organization and quarterly team goals.
The route
Five questions, in order
This playbook starts after the strategy has been chosen. Each stage asks one question and uses one proven tool to answer it, moving from the strategy on paper to what each team does this quarter. Three points on the route stop work that would otherwise go wrong quietly.
On timing: stages 1 to 4 make up the yearly planning cycle and take six to eight weeks. Stage 5 then repeats every quarter, and the scorecard from stage 2 is reviewed every month.
-
What has to go right for the strategy to work?Stage 1 · Strategy Map
Passes on: a few objectives, linked by cause and effect
An objective links to nothing?Cut it, or find the missing link.
-
How will you measure progress?Stage 2 · Balanced Scorecard
Passes on: a measure, a target and an owner for every objective
-
Is the organization set up to deliver?Stage 3 · McKinsey 7S
Passes on: the parts of the organization pulling against the strategy
Something pulls against it?Fix it before handing out targets.
-
Who commits to what this year?Stage 4 · Hoshin Kanri
Passes on: yearly targets each level has argued for and agreed
A target nobody believes?Keep negotiating. Don't sign it.
-
What does each team do this quarter?Stage 5 · OKR
Passes on: quarterly team goals that add up to the yearly targets
- How do you keep it on track?Then · A monthly, quarterly and yearly review rhythm
The example
One strategy, followed all the way through
This playbook follows one company from start to finish. It is an illustrative composite, and the details are simplified.
A 1,200-person dairy company in Uruguay has sold mostly milk powder abroad, at commodity prices, for decades. Its board has chosen a new strategy: sell branded yogurt and cheese in Brazil and Argentina, where margins are higher. The strategy fits on one slide. Two years earlier, a similar slide changed nothing. Nobody could say who was meant to do what differently on Monday morning.
Each stage below ends with what the company produced at that step, so you can watch one stage's output become the next stage's input.
Stage 1 of 5
What has to go right for the strategy to work?
Tool: Strategy Map · Time: 1 to 2 weeks
A strategy on one slide says where to go. A strategy map shows what has to go right to get there. It sorts the strategy's objectives into four layers and links them by cause and effect, read from the bottom up: people and skills make better processes possible, better processes win customers, and customers deliver the money.
Keep it to a dozen objectives or fewer. Then test every one: what does it cause in the layer above? An objective that drives nothing is either missing a link, or doesn't belong in the strategy.
Read one chain aloud, from the bottom layer to the top, to test it. For the dairy company: hire food scientists, so it can launch six new products a year, so it wins shelf space in Brazil, so branded sales grow, so the margin rises. If a chain sounds like wishful thinking when spoken, a link is missing.
What goes inThe chosen strategy.
What comes outA one-page map of a few objectives, each linked to the one it drives.
Skip it if: you already have a current strategy map that the leadership team agrees with.
- FFinancial
- What the strategy must deliver in money
- CCustomer
- What customers must see and choose
- PInternal process
- What the company must do well inside
- LLearning and growth
- The people, skills and systems that make it possible
Financial
- Operating margin from 6% to 10%
- Branded products at 40% of sales
↑ drives financial ↑
Customer
- Shelf space in Brazilian supermarkets
- A brand chosen for quality
↑ drives customer ↑
Internal process
- Six new products a year
- Less spoilage in the cold chain
- Distribution partners in Brazil
↑ drives internal process ↑
Learning and growth
- Food scientists for new products
- A sales team that sells brands, not tonnes
- A new head-office building
Handed to stage 2: ten objectives in four layers. The crossed-out one, a new head-office building, linked to nothing above it and was cut.
Decision point
If an objective links to nothing, cut it or find the missing link. Objectives that sit outside the cause-and-effect chain still attract money and attention, so they quietly pull against the ones that matter.
Stage 2 of 5
How will you measure progress on each objective?
Tool: Balanced Scorecard · Time: 1 to 2 weeks
A map shows what has to go right. A balanced scorecard says how you will know. For every objective on the map it sets four things: a measure, a target, an initiative (the project that will move the measure) and an owner.
The point of the four perspectives is balance. Financial results arrive last. Customer, process and people measures move first, so they warn you early when the strategy is drifting, while there is still time to act.
Keep to one or two measures per objective, and prefer a measure you can already collect over a perfect one you can't. A measure nobody updates is worse than none, because it looks like control.
What goes inThe objectives from stage 1.
What comes outA measure, a target, an initiative and an owner for every objective.
Skip it if: never. Without it, nobody can tell whether the strategy is working until the year-end figures.
| Objective | Measure | Target this year | Initiative | Owner |
|---|---|---|---|---|
| Branded products at 40% of sales | Branded share of revenue | 25% | Brazil and Argentina launch | Chief executive |
| Shelf space in Brazilian supermarkets | Chains listing the products | 8 chains | Distribution partner program | Head of sales, Brazil |
| Less spoilage in the cold chain | Product lost before sale | Under 2% | Refrigerated trucks upgrade | Operations director |
| A sales team that sells brands | Sales staff trained in brand selling | 30 of 40 | Sales training program | Head of people |
Handed to stage 3: a scorecard of ten objectives. The highlighted row matters most later on: its target depends on how sales staff are paid, which stage 3 turns up.
Stage 3 of 5
Is the organization set up to deliver the strategy?
Tool: McKinsey 7S · Time: 1 week
Before handing out targets, check that the organization can deliver them. The McKinsey 7S model looks at seven parts of an organization that have to fit together: strategy, structure, systems (how work is measured and paid), shared values, style (how leaders behave), staff and skills.
Compare each part with the new strategy. The usual failures are in the less visible ones: a bonus scheme, a reporting line or a habit that still rewards the old way. People follow what they are paid and praised for, not what the strategy slide says.
The first three elements are the hard ones, and they can be changed by decision. The other four are soft, and change slowly, through hiring, example and time. Fix the hard ones now; plan for the soft ones over the year.
What goes inThe strategy and scorecard from stages 1 and 2.
What comes outThe parts of the organization pulling against the strategy, and what to change in each.
Skip it if: the strategy is a small adjustment that leaves how people work unchanged.
| Element | Today | Fits the strategy? |
|---|---|---|
| Strategy | Branded products in Brazil and Argentina | Yes, by definition |
| Structure | Organized by plant, not by market | No. Nobody owns Brazil |
| Systems | Sales bonus paid on tonnes sold | No. It rewards milk powder |
| Shared values | Pride in volume and reliability | Partly |
| Style | Decisions made at head office | Partly |
| Staff | Engineers and plant managers | Partly |
| Skills | No brand marketing experience | No. Two hires needed |
Handed to stage 4: three changes before targets go out: a manager for Brazil, two brand marketers, and a sales bonus paid on branded revenue instead of tonnes.
Decision point
If part of the organization pulls against the strategy, fix it before handing out targets. A sales team paid on tonnes will sell milk powder whatever its targets say. That is what sank the company's previous strategy.
Stage 4 of 5
Who commits to what this year?
Tool: Hoshin Kanri · Time: 3 to 4 weeks, once a year
Now turn the scorecard into commitments, level by level. Hoshin Kanri takes a few long-term objectives, sets this year's step toward each, and passes the targets down the organization by negotiation rather than by order.
The negotiation, called catchball, is the point. The people doing the work test each target against what they know, before it is committed rather than at the year-end review. A target a team has argued for is one it owns.
The agreed result is usually kept on one page, sometimes called an X-matrix, that shows each yearly objective with the projects, measures and owners that serve it. If a project on that page serves no objective, it is a candidate to stop.
What goes inThe scorecard from stage 2, and the organization as fixed in stage 3.
What comes outYearly targets for each level, argued for and agreed.
Skip it if: the organization has fewer than three levels. Set the yearly targets together in one room.
- 1Breakthrough objective
- A three-to-five-year goal from the strategy
- 2Yearly objective
- This year's step toward it
- 3Catchball
- Each level proposes, the next replies with what it can commit to, until both agree
One round of catchball, for one target
Yearly objectiveBranded products at 25% of sales this year
- Leadership proposedListings in 12 Brazilian supermarket chains
- The Brazil sales team replied8 is possible, but only with a distribution partner signed by June
- Agreed and signed8 chains, a partner by June, and a budget for the partner search
Handed to stage 5: yearly targets for every department, each one argued for. The Brazil team's target came down from 12 chains to 8, and became believable.
Decision point
If a target is one nobody believes, keep negotiating, and don't sign it. A target imposed over a team's objection becomes the team's excuse when it is missed.
Stage 5 of 5
What does each team do this quarter?
Tool: OKR · Time: a week each quarter
A yearly target is too far away to steer a team's week. OKRs break it into quarters. Each team sets an objective, a short statement of what should change this quarter, and two to four key results: numbers that show whether it did.
Every OKR should point at a yearly target from stage 4. A team that can't say which target its OKR serves is working on something outside the strategy.
Keep OKRs separate from pay. Teams paid on hitting their key results set ones they know they will hit, and the stretch that makes OKRs useful disappears. Pay follows the scorecard and the yearly targets; OKRs steer the quarter. Score each key result at the end of the quarter, and carry what the scores teach into the next set.
What goes inEach team's yearly targets from stage 4.
What comes outQuarterly objectives and key results for each team, traced to a yearly target.
Skip it if: the team's yearly target is already short-term and concrete enough to steer each week.
Example: the Brazil sales team's OKR for the first quarter
ObjectiveGet our yogurt onto Brazilian shelves
- Key result 1A distribution partner signed for São Paulo state
- Key result 2Listed in 3 supermarket chains
- Key result 3Reorder rate above 60% in the stores that list us
Handed on: every team's quarter traced to a yearly target. Key result 1 here is the June partner deadline from stage 4, brought forward.
Pace
Fast track or thorough
A small company can run stages 1 to 4 in a single offsite. A large one needs the thorough run, because the catchball in stage 4 has to pass through every level.
| Stage | Fast track (one offsite) | Thorough (6 to 8 weeks) |
|---|---|---|
| 1. Strategy Map | Drawn by the leadership team in a morning | Tested with each department |
| 2. Balanced Scorecard | One measure per objective | Measures tested against the data you have |
| 3. McKinsey 7S | Leaders rate the seven elements | Interviews across levels |
| 4. Hoshin Kanri | Targets agreed in the room | Catchball through every level |
| 5. OKR | Leadership OKRs only | Every team, every quarter |
Failure modes
How strategy execution goes wrong
| What happens | What it looks like | The fix |
|---|---|---|
| Too many objectives | Thirty priorities, so none of them is one | A dozen or fewer, all linked on the map |
| Measuring only money | Problems show up a year late | Use all four perspectives |
| Old incentives left in place | Targets say one thing, pay says another | Check the 7S systems before targets go out |
| Targets handed down | Teams miss them and blame the target | Agree targets through catchball |
| Planning, then silence | The plan is reviewed again next year | Review monthly, reset quarterly |
After the playbook
Keeping it on track
Execution lives in the review rhythm. Review the scorecard every month, set new OKRs every quarter, and run the Hoshin cycle every year. Each review asks the same question: are the early measures moving the way the map says they should?
Choose a few KPIs from the scorecard to watch weekly. If the early measures move and the financial ones don't, the map has a broken link, and the strategy itself may need another look. That is the moment to go back to stage 1, not to push harder on the targets.
Common questions
Strategy execution: quick answers
What is an example of a balanced scorecard?
For a company moving into branded products, one row per perspective might be: branded share of revenue at 25% this year (financial), listings in eight supermarket chains (customer), spoilage under 2% (internal process), and 30 of 40 sales staff trained in brand selling (learning and growth). Each row also names an initiative and an owner.
How do you execute a business strategy?
In five steps. Map the objectives the strategy depends on and how they cause one another. Give each a measure, target and owner. Check that structure, pay and skills support the strategy. Agree yearly targets level by level. Then set quarterly team goals that trace back to them.
Why do most strategies fail in execution?
Usually because the organization still rewards the old way. Targets go out, but bonuses, reporting lines and habits stay as they were, so people keep doing what they are paid for. Too many objectives, and no regular review, are the other common causes.
What is the difference between a strategy map and a balanced scorecard?
They are companions. The strategy map shows the objectives and how they cause one another, across four perspectives. The balanced scorecard adds a measure, a target, an initiative and an owner to each objective, so progress can be tracked.
What is the difference between OKRs and Hoshin Kanri?
Hoshin Kanri sets yearly targets and passes them down the organization by negotiation. OKRs set quarterly goals for each team. They work well together: Hoshin decides the year, and OKRs steer each quarter toward it.
How often should a strategy be reviewed?
The scorecard monthly, team OKRs quarterly, and the strategy map and yearly targets once a year. Review the strategy itself sooner if the early measures move as planned and the financial results still don't.
Where does SWOT fit in strategy execution?
Before it. SWOT helps choose a strategy; this playbook starts once the strategy has been chosen. If the strategy is still being decided, start with the market expansion playbook or a SWOT, then come back.
Frameworks in this playbook
- Strategy MapStage 1: What has to go right for the strategy to work?
- Balanced ScorecardStage 2: How will you measure progress on each objective?
- McKinsey 7SStage 3: Is the organization set up to deliver the strategy?
- Hoshin KanriStage 4: Who commits to what this year?
- OKRStage 5: What does each team do this quarter?
- KPIsAfter: the few scorecard measures watched weekly
- SWOT AnalysisBefore: choosing the strategy in the first place