
Business Model Canvas: 9 Building Blocks
Business Model Canvas is a one-page visual template with 9 building blocks that describes how an organization creates, delivers, and captures value—providing a shared language for business model discussion.
Before you start
Is the Business Model Canvas your framework?
The Business Model Canvas describes a business that already runs. Four of its nine building blocks — Key Partnerships, Key Activities, Key Resources and Customer Relationships — only have honest answers once there are suppliers, staff and customers to describe. Fill them speculatively and the canvas becomes a wish list.
Its real work is joining two halves that organizations usually plan separately. The right-hand blocks describe the market. The left-hand blocks describe the machine that serves it. The Value Proposition sits between them, and the canvas earns its keep when the two sides turn out not to match.
| If your real problem is… | You probably want |
|---|---|
| We have no customers yet and are testing whether a business exists | Lean Canvas — the startup adaptation, built for hypotheses rather than operations Compare BMC and Lean Canvas |
| We do not understand why customers buy from anyone | Jobs to Be Done — the canvas assumes you can already state the value proposition |
| We need to know whether the market is worth entering | Porter’s Five Forces — there is no competition block on the canvas Compare Five Forces and Wardley |
| We know the model and need to execute against it | OKR or Balanced Scorecard — the canvas describes, it does not drive delivery Compare OKR and Balanced Scorecard |
| We need to see where our position is eroding over time | Wardley Mapping — the canvas is a snapshot with no time axis |
| We need to pick which customers to serve | STP — the canvas has one box for segments and no method for choosing between them |
| We run a business and cannot see how the whole model fits together | Business Model Canvas — you are in the right place |
The test that separates a real canvas from a poster
Fill it in, then try to draw two sets of lines. Every Revenue Stream should trace back to a named Customer Segment, and every significant cost in the Cost Structure should trace forward from a Key Resource or Key Activity you actually listed. If the lines do not connect, you have nine lists rather than a business model — and the gap is usually where the money is being lost.
What Is It?
The Business Model Canvas is a one-page template with nine building blocks that together describe how an organization creates, delivers and captures value. Alexander Osterwalder developed it as part of his 2004 doctoral thesis at the Université de Lausanne under Yves Pigneur, and the two published it for a general readership in Business Model Generation in 2010.
The nine building blocks are Customer Segments, Value Propositions, Channels, Customer Relationships, Revenue Streams, Key Resources, Key Activities, Key Partnerships and Cost Structure. They are not a list. Their arrangement on the page carries the argument: market on the right, infrastructure on the left, the Value Proposition joining them, and money at the bottom — revenue under the market it comes from, costs under the machine that generates them.
That layout is what makes the canvas useful rather than merely tidy. A business model is a claim that a particular machine can serve a particular market at a margin, and the canvas puts both halves of that claim on one sheet where they can be checked against each other. Most of the value comes from the checking, not the filling.
Because it fits on a wall and uses ordinary words, it also does something no business plan does: it lets a finance lead, an engineer and a salesperson argue about the same object. The canvas is released under a Creative Commons license, which is why it turns up in nearly every strategy tool on the market.
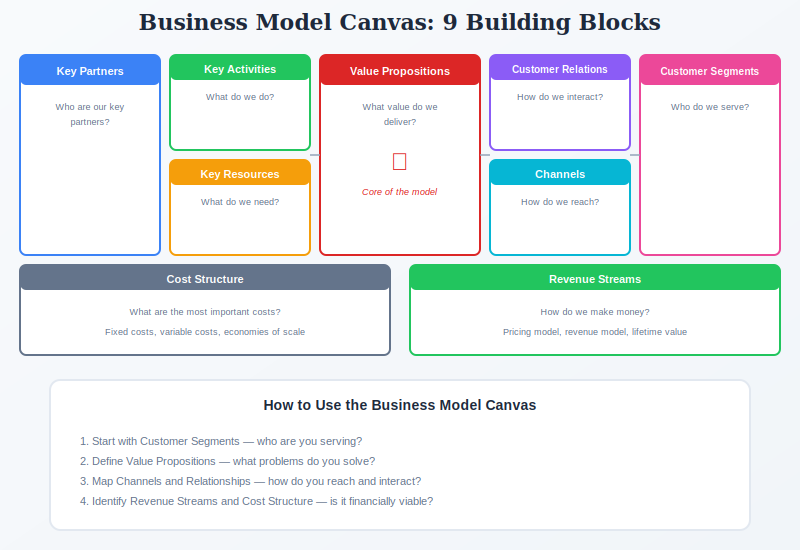
Quick Reference
The canonical structure
The nine building blocks, one by one
There is no officially numbered fill order, unlike the Lean Canvas. But the blocks constrain each other in a particular direction, and filling them customer-first is near-universal practice: everything on the infrastructure side only makes sense once you know who is served and what they are offered.
Blocks 1–5 are the market side. Blocks 6–9 are the infrastructure side. The Value Proposition is the hinge.
| Block | The question it answers | What a weak answer looks like |
|---|---|---|
| 1. Customer Segments | For whom are we creating value, and who are our most important customers? | “Small businesses.” A category, not a segment — you cannot name twenty of them. |
| 2. Value Propositions | What bundle of products and services do we offer each segment, and which of their problems does it solve? | “Quality and service.” True of every competitor, therefore not a proposition. |
| 3. Channels | How do we reach each segment to communicate, sell, deliver and support? | “Digital marketing.” Names a budget line rather than a route to a buyer. |
| 4. Customer Relationships | What type of relationship does each segment expect — self-service, dedicated, automated, community? | “Excellent customer service.” An aspiration, not a relationship type. |
| 5. Revenue Streams | What are customers really willing to pay for, how do they pay now, and how would they prefer to? | A single number with no pricing mechanism behind it. |
| 6. Key Resources | What assets does the model require — physical, intellectual, human, financial? | “Our people.” Every business has people. Which ones, and how many hours? |
| 7. Key Activities | What must we do well and repeatedly for the model to work? | A list of everything the company does, rather than the few things it must not get wrong. |
| 8. Key Partnerships | Who supplies what we do not build, and which activities do we outsource? | Left blank because nobody in the room owns supplier relationships. |
| 9. Cost Structure | What does running this model cost, and which resources and activities are most expensive? | Categories with no numbers. This is the block most often skipped, and the one that most often changes the decision. |
On the two halves
The split down the middle is the part most often lost when the canvas is taught as a list of nine boxes. Blocks 1–5 describe a market you do not control. Blocks 6–9 describe a machine you do. Revenue sits under the market, cost sits under the machine, and the Value Proposition is the only block that belongs to both.
That is why a canvas can be filled in completely and still be wrong. Each half can be individually accurate while the two fail to meet — which is exactly what the worked example below shows.
Core Features
- One page, nine blocks: the whole model visible at once, which is what makes contradictions between blocks findable
- A shared vocabulary: finance, product and sales describe the same business in the same nine words
- Left–right structure: infrastructure on the left, market on the right, value proposition joining them
- Designed to be provisional: sticky notes on a printed sheet, so a block can be moved rather than rewritten
- Descriptive, not prescriptive: it records a model and exposes its gaps; it does not tell you which model to choose
- Openly licensed: Creative Commons Attribution-ShareAlike, which is why it is embedded in so many tools
- Multi-canvas by design: a company with genuinely different models draws one canvas per model, not one blended canvas
Worked example
A canvas that changed the plan
An illustrative composite. A residential HVAC company in Columbus, Ohio, with eleven technicians and a break-fix repair business, considering a $29-a-month maintenance subscription alongside it. The left column is the first pass in the room; the right is what survived costing.
Note where the changes land. The market side barely moved. Both highlighted rows are on the infrastructure side, and together they turned a growth plan into a capacity question.
| Building block | First pass | After costing it |
|---|---|---|
| 1. Customer Segments | “Homeowners” | Homeowners in the eight suburbs already inside the service radius, with systems 8–15 years old. Roughly 14,000 households. |
| 2. Value Propositions | “Peace of mind” | “No emergency callout fee, and we come before it breaks.” |
| 3. Channels | “Website and local ads” | An offer printed on the invoice at the end of every repair job. They already complete about 2,400 repair visits a year. |
| 4. Customer Relationships | “Great service” | Two scheduled visits a year, same technician where possible, booked automatically. |
| 5. Revenue Streams | “$29/month subscription” | $348 per household per year, billed monthly. Target: 5,000 subscribers within three years. |
| 6. Key Resources | “Our technicians” | Eleven technicians, roughly 18,700 billable hours a year in total, and already close to full. Technician hours — not customers — are the binding constraint. |
| 7. Key Activities | “Repairs” | Two scheduled 45-minute visits per subscriber per year, plus priority dispatch when something does break. |
| 8. Key Partnerships | Left blank | Existing parts distributor; a billing processor for the monthly charge. |
| 9. Cost Structure | “Technician time and parts” | About 2.5 technician-hours per subscriber per year including travel. At 5,000 subscribers that is 12,500 hours — two thirds of total capacity — consumed by the subscription, leaving too little for the repair work that currently funds the business. |
What the canvas actually did
Nothing on the market side was wrong. The offer was attractive, the channel was free and the segment was reachable. The model failed the trace test on the left: Revenue Streams assumed 5,000 subscribers, while Key Resources could not supply them without cannibalizing the repair revenue that paid for the technicians in the first place.
They launched at 1,200 subscribers as a cap rather than a target, and treated the number as a hiring trigger. That decision came from putting Revenue Streams and Key Resources on the same sheet. A spreadsheet forecast, built one column at a time, would not have put them next to each other.
When to Use
- Making an existing business model explicit, usually for the first time, so it can be argued about
- Evaluating a pivot or a new line alongside the current model, drawn as two canvases side by side
- Due diligence on an acquisition target, where the question is how the target actually earns money
- Onboarding a leadership team or board onto the fundamentals in one session
- Teaching business model structure — the canvas remains the standard vocabulary in business schools
- Stress-testing whether infrastructure can support a revenue plan, as in the example above
- Comparing your model against a competitor’s, by drawing theirs from public information
When NOT to Use
- Pre-revenue startups still testing whether a problem exists — use Lean Canvas, which replaces the four blocks you cannot honestly fill
- Competitive or regulatory analysis — there is no block for either; use Porter’s Five Forces
- Questions about how position changes over time — the canvas is a snapshot; use Wardley Mapping
- Financial modeling — Cost Structure and Revenue Streams are prompts, not a P&L
- Operational or process design — use Value Stream Mapping
- Driving delivery against a strategy already agreed — use OKR or Balanced Scorecard
In practice
How Business Model Canvases go wrong
The canvas takes an hour. Keeping it honest is the hard part, and it fails in a small number of recognizable ways.
| What you see | What it usually means | What to do |
|---|---|---|
| Cost Structure has categories but no numbers | The room ran out of time, or nobody present owns the cost base | Cost it, even roughly. This is the block that most often changes the decision, and a canvas without it is a marketing document. |
| One canvas covering several distinct businesses | Blocks are being blended, so every one reads as vague | Draw one canvas per model. If two lines of business have different customers and different cost drivers, they are two models. |
| Customer Segments says “everyone” or names a category | Segmentation has not been done | Narrow until Channels and Customer Relationships have obvious answers. If they do not, the segment is still too wide. |
| Key Partnerships is empty | Nobody in the room owns supplier relationships | Every operating business has partners. An empty block usually means the wrong people are at the session, not that there are none. |
| The canvas describes the company as it is meant to be | It has become an aspiration document | Draw the current model first and date it. Draw the target as a second canvas. The value is in the difference between the two. |
| Revenue Streams cannot be traced to a segment | Revenue is being reported by product line, not by who pays | Re-map revenue onto segments. Businesses regularly discover a segment they serve well and price badly. |
| Filled in once, photographed, never reopened | Treated as a workshop artifact | Revisit when something material changes — a new channel, a pricing change, a large customer lost. The canvas is cheap to redraw, which is the point of sticky notes. |
Sourced
Origins, and how to cite it
It began as a doctoral thesis, six years before the book.
Alexander Osterwalder’s 2004 dissertation at the Université de Lausanne, supervised by Yves Pigneur, proposed a “business model ontology” — a formal vocabulary for describing any business model. The nine blocks are that ontology made drawable. This matters for citation: academic work should generally cite the thesis for the concept and the 2010 book for the tool.
Osterwalder, A. (2004) The Business Model Ontology: A Proposition in a Design Science Approach. Doctoral thesis, Université de Lausanne.
The book itself was crowd-written, which is unusual enough to be worth knowing.
Business Model Generation was produced with 470 practitioners from dozens of countries who paid to join the writing process and are credited as co-creators. It was self-published before Wiley picked it up. The canvas is released under a Creative Commons Attribution-ShareAlike license, which is why it appears in nearly every strategy tool without a license fee — attribution to Strategyzer AG is the condition.
Osterwalder, A. & Pigneur, Y. (2010) Business Model Generation. Hoboken, NJ: John Wiley & Sons.
There is no block for competition, regulation or the outside world — and this is the most-cited weakness.
Nine blocks describe the firm and its customers. None describes rivals, substitutes, regulators, technology shifts or macro conditions. Business Model Generation does address this, through a separate “business model environment” map with four external forces, but that tool is far less widely taught than the canvas and most practitioners never meet it. The practical consequence is that a canvas can look complete and coherent for a model that a competitor is about to make obsolete.
Its authors moved on; most teaching did not.
Osterwalder and Pigneur published the Value Proposition Canvas in 2014, specifically because the Value Proposition block was too coarse to work with. Testing Business Ideas followed in 2019 with an experiment library, and The Invincible Company in 2020 added portfolio-level maps for managing several models at once. Strategyzer’s own current practice treats the 2010 canvas as the opening move. A great deal of teaching still stops there, which is a common pattern — the framework freezes at version one while its authors keep going.
Osterwalder, A., Pigneur, Y., Bernarda, G. & Smith, A. (2014) Value Proposition Design; Osterwalder, A., Pigneur, Y., Smith, A. & Etiemble, F. (2020) The Invincible Company. Both John Wiley & Sons.
How to cite it.
Harvard: Osterwalder, A. and Pigneur, Y. (2010) Business Model Generation: A Handbook for Visionaries, Game Changers, and Challengers. Hoboken, NJ: John Wiley & Sons.
APA: Osterwalder, A., & Pigneur, Y. (2010). Business model generation: A handbook for visionaries, game changers, and challengers. John Wiley & Sons.
For the academic origin: Osterwalder, A. (2004). The business model ontology: A proposition in a design science approach (Doctoral dissertation, Université de Lausanne).
What that means for using it.
Treat the canvas as a description that exposes contradictions, not as a plan. Cost the Cost Structure. Draw a second canvas rather than blending two businesses into one. And when the question is competitive rather than structural, reach for a different tool instead of expecting the nine blocks to answer it.
Key Strengths
- Puts both halves on one page: market and infrastructure become checkable against each other
- Shared language: functions that normally argue past each other describe the business in the same nine terms
- Fast and cheap to redraw: a wrong canvas costs an hour, so being wrong is affordable
- Universally recognized: taught worldwide, so no explanation is needed before a session starts
- Works on other companies: a competitor’s canvas can be drawn from public information
Key Weaknesses
- No block for competition, regulation or the external environment
- No time dimension — it captures now, not how now became this or where it is heading
- Descriptive rather than predictive: it cannot tell you whether the model will work
- Cost Structure and Revenue Streams invite one-line answers where numbers are needed
- Encourages a single canvas for organizations that genuinely run several models
- The Value Proposition block is too coarse to work with, which is why its authors added a second canvas for it
How It Works
| 1 Primary Input | Business idea, customer insights, market understanding |
|---|---|
| 2 Data You Need | Customer segments, value proposition hypothesis, cost and revenue estimates |
| 3 Primary Output | One-page visual business model for discussion and iteration |
Comparison with Related Frameworks
Business Model Canvas vs Lean Canvas
Lean Canvas is a startup-optimized adaptation that replaces Partners, Activities, and Relationships with Problem, Solution, Key Metrics, and Unfair Advantage. Use BMC for established businesses; Lean Canvas for startups validating ideas.
Business Model Canvas vs Wardley Mapping
Wardley Mapping shows strategic positioning and how components evolve; the BMC shows business model structure at a moment in time. The canvas answers “what is our business model?”; Wardley answers “where is it heading, and what is about to become a commodity?” The canvas has no time axis at all, which is the single largest reason to reach for Wardley alongside it.
Business Model Canvas vs Porter’s Five Forces
These answer different halves of the same question and are frequently confused because both get called “strategy tools.” Porter’s Five Forces looks outward at whether an industry is worth competing in. The BMC looks inward at whether your particular machine can serve a market profitably. A canvas can be internally coherent for a business in a structurally unattractive industry — which is precisely the failure Five Forces is designed to catch.
Sequencing
What to run before and after
The canvas records a model and exposes its gaps. It does not generate the model, and it does not deliver it, so it sits between two activities that carry more of the work than the grid does.
Before
Know who you serve and why they buy
Blocks 1 and 2 are the hinge of the whole canvas. Filled from the room rather than from customers, everything downstream inherits the guess.
During
Fill customer-first, then cost the left side
An hour to fill, longer to cost. The output that matters is not the canvas but the list of places where the market side and the infrastructure side fail to meet.
After
Test the contradiction, then drive delivery
Whatever the trace test exposed becomes the next question — usually a costing exercise or a capacity check. Once the model holds, execution needs a different instrument.
Common questions
Business Model Canvas: quick answers
What are the 9 building blocks of the Business Model Canvas?
Customer Segments, Value Propositions, Channels, Customer Relationships, Revenue Streams, Key Resources, Key Activities, Key Partnerships, and Cost Structure. The nine building blocks are grouped into four areas that Osterwalder’s original ontology called pillars: who you serve and how you reach them, what you offer, what it takes to deliver, and what comes in and goes out financially. The right-hand side of the canvas concerns the market, the left-hand side concerns the infrastructure that serves it, and the Value Proposition sits in the middle joining the two.
What order should you fill in the Business Model Canvas?
Start with Customer Segments, then Value Propositions, and work rightward and downward: Channels, Customer Relationships, Revenue Streams, then across to Key Resources, Key Activities, Key Partnerships, and finally Cost Structure. Unlike the Lean Canvas, the Business Model Canvas has no officially numbered sequence, but filling it customer-first is the near-universal teaching practice, because every block on the infrastructure side only makes sense once you know who is being served and what they are being offered.
Who created the Business Model Canvas, and how do I cite it?
Alexander Osterwalder created it as part of his 2004 doctoral thesis at the Université de Lausanne, supervised by Yves Pigneur, and the two published it for a general audience in Business Model Generation in 2010. Harvard style: Osterwalder, A. and Pigneur, Y. (2010) Business Model Generation: A Handbook for Visionaries, Game Changers, and Challengers. Hoboken, NJ: John Wiley & Sons. APA style: Osterwalder, A., & Pigneur, Y. (2010). Business model generation: A handbook for visionaries, game changers, and challengers. John Wiley & Sons. For the academic origin, cite the thesis: Osterwalder, A. (2004). The business model ontology: A proposition in a design science approach (Doctoral dissertation, Université de Lausanne).
What does BMC stand for?
BMC is the common abbreviation for Business Model Canvas. You will also see it written as the nine building blocks canvas or the Osterwalder canvas. It is distinct from the Lean Canvas, which is a different nine-box adaptation aimed at startups, and from the Value Proposition Canvas, which is a separate Strategyzer tool that magnifies two of the nine blocks.
What is the difference between the Business Model Canvas and the Lean Canvas?
Same nine-box grid, four different boxes, opposite purposes. Ash Maurya removed Key Partners, Key Activities, Key Resources and Customer Relationships and replaced them with Problem, Solution, Key Metrics and Unfair Advantage. The Business Model Canvas documents how an operating business works; the Lean Canvas tests whether a business exists at all. If you have customers, revenue and staff, the four blocks Maurya removed are exactly the ones carrying your real constraints, and you want the original.
Is the Business Model Canvas free to use?
Yes. The canvas is published under a Creative Commons Attribution-ShareAlike license, which is why it appears in so many tools and templates without a license fee. You may use it commercially, including in client work and training, provided you attribute Strategyzer AG and share any adaptation under the same terms. The official template is available from Strategyzer; the books are not free.
How long does a Business Model Canvas take to fill in?
A first pass takes one to two hours with the right people in the room. That first pass is not the deliverable. What takes time is checking the canvas against reality, which usually means costing the Cost Structure properly and confirming that Revenue Streams actually trace back to named Customer Segments. Teams that finish in an hour and never return have produced a poster.
Does the Business Model Canvas cover competitors?
No, and this is its most commonly cited gap. There is no block for competition, regulation, technology shifts or macro conditions. Business Model Generation addresses the environment through a separate Business Model Environment map, but that tool is far less widely taught than the canvas itself, so most users never encounter it. If competitive position is your actual question, pair the canvas with Porter’s Five Forces or Wardley Mapping rather than expecting the nine blocks to surface it.
Deep Resources
Frameworks related to Business Model Canvas
- Lean CanvasStartup-optimized one-page business plan with Problem, Solution, Key Metrics, and Unfair…
- Value Stream MappingVisualize the flow of materials and information through a process to identify waste and…
- Wardley MappingVisual mapping of your strategic landscape showing component evolution and dependencies to…