RICE Score: Quantitative Feature Prioritization
RICE Score is a quantitative prioritization framework that evaluates features based on Reach, Impact, Confidence, and Effort using the formula: (Reach × Impact × Confidence) / Effort
Before you start
Is RICE your framework?
RICE produces a single ranked list with a number behind every row. That is its whole purpose, and it is what distinguishes it from every 2x2 and every set of tiers. It is worth the extra work when the ranking has to be defended to someone who was not in the room.
The cost is that it needs four estimates per candidate, and one of them — Reach — has to be a real count from real data. A team without that data can still fill in the spreadsheet, and the output will look exactly as authoritative as one built on evidence.
| If your real problem is… | You probably want |
|---|---|
| We need a decision this afternoon and have no usage data | Value vs Effort Matrix — ninety minutes, no data, four groups instead of a ranking Compare RICE and Value/Effort |
| The date is fixed and the question is what ships | MoSCoW — scope against a timebox, which a ranked list does not address Compare RICE and MoSCoW |
| We do not know which features customers actually value | Kano Model — RICE will faithfully rank a list built on guesses Compare RICE and Kano |
| We want delight and differentiation weighed in, not just volume | ICED — four dimensions including delight, lighter than RICE |
| The real question is urgency against importance | Priority Matrix — a different question entirely |
| Work arrives continuously with no planning cycle | Kanban — a queue does not need a score |
| A backlog nobody can rank | The feature prioritization playbook, where RICE is stage 3 of 5 |
| We need a defensible ranked order, and we have the numbers | RICE — you are in the right place |
The test that separates RICE from a weighted opinion score
Is Reach an actual count, over a stated time period, taken from data you already hold? Reach is the one input that is supposed to come from outside the room — customers per quarter, sessions per month, tickets per release.
If Reach has been scored one to ten alongside the others, the formula is multiplying three opinions and dividing by a fourth, and the decimal places are doing persuasive work that the inputs cannot support.
What Is It?
RICE is a prioritization scoring model that ranks candidates by a single number: (Reach × Impact × Confidence) ÷ Effort. Sean McBride created it at Intercom in 2016 to settle a specific argument: whether a small improvement affecting everybody beats a large one affecting a few.
The four inputs are deliberately unlike each other. Reach is a count of how many people something affects in a defined period. Impact is a fixed multiplier from a short scale. Confidence is a percentage discount for how much you trust the first two. Effort is person-months. The result is roughly impact per person-month, which is why the scores are only comparable within one list scored the same way.
What RICE adds over lighter methods is the Confidence term. Most prioritization frameworks treat an estimate as a fact; RICE requires you to state how much you believe your own numbers and discounts the score accordingly. That single term is the strongest argument for the extra work it demands.
It is a practitioner heuristic from one company’s blog rather than a researched method, and it does not claim otherwise. Used well it makes a ranking arguable; used badly it makes a guess look like arithmetic.
Quick Reference
The canonical structure
The formula, and what each input must be
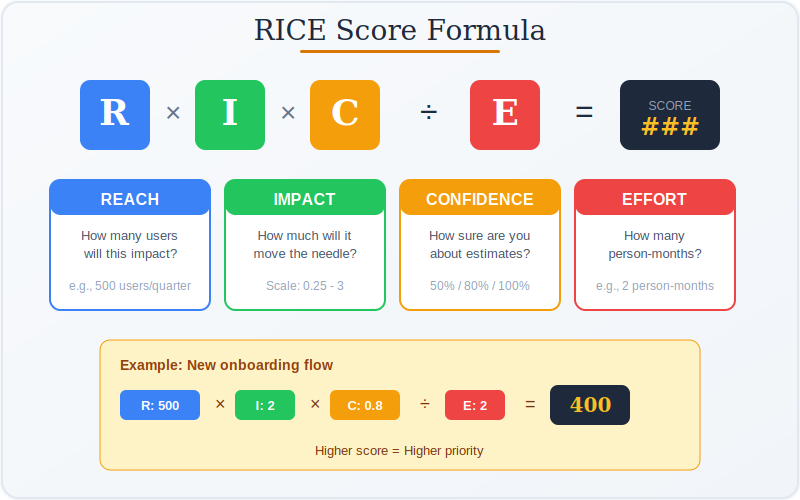
The formula is RICE = (Reach × Impact × Confidence) ÷ Effort. Each input has a defined unit, and substituting your own scales is where most implementations quietly break.
Scores mean nothing on their own. A RICE score of 42 is only interpretable next to other scores computed with the same definitions, in the same list, at the same time.
| Input | Unit and scale | What goes wrong |
|---|---|---|
| Reach | A count, per stated time period. Customers per quarter, sessions per month, tickets per release. Taken from data, not judgment. | Scored 1–10 like the others. This is the single most common error. Reach is the only input meant to come from outside the room, and scoring it removes the model’s one anchor to reality. |
| Impact | A fixed multiplier: 3 massive, 2 high, 1 medium, 0.5 low, 0.25 minimal. | Replaced with a 1–10 scale, which widens the range and lets Impact overwhelm Reach. The narrow scale is deliberate. |
| Confidence | A percentage: 100% high, 80% medium, 50% low. Below 50% means go and find out rather than score it. | Always set to 100%, which deletes the term. If nothing on your list is below 100%, nobody is being honest about the estimates. |
| Effort | Person-months, estimated by the people who will do the work. | Systematically underestimated. It is the denominator, so optimism here inflates the score most for the items that are hardest — the error compounds in the worst direction. |
On what the score actually is
Reading the units out loud is the fastest way to see what RICE is and is not. Reach is people, Impact is a multiplier, Confidence is a discount, Effort is person-months — so the output is expected impact per person-month of work, discounted for uncertainty.
That is a genuinely useful quantity, and it is also a rate of return. It says nothing about whether an item is strategically necessary, contractually required, or a dependency for something else on the list. Those things do not have a term in the formula, and they still have to be decided by somebody.
Source
Where RICE came from
RICE has something most prioritization frameworks lack: a single, checkable origin. Sean McBride, a product manager at Intercom, developed it in 2016 because the team’s existing approach kept producing decisions nobody could reconstruct a month later. Intercom published it on its product blog, and that post remains the primary source.
The problem it was built to solve is worth knowing, because it explains the design. Intercom was not short of ideas or short of opinions — it was short of a way to compare a small improvement affecting everybody against a large improvement affecting a handful of accounts. Reach as a raw count is what makes that comparison possible, and it is why substituting a score for it defeats the purpose.
The Confidence term has a similarly specific origin: it exists because teams were producing high scores from numbers they had invented, and there was no way to distinguish a well-evidenced estimate from a hopeful one inside the ranking.
Because it comes from a company blog rather than a journal, there is no peer-reviewed literature testing RICE against alternatives. It is a well-designed heuristic with a clear rationale, and that is the honest description of its status.
Core Features
- One number per candidate: (Reach × Impact × Confidence) ÷ Effort, producing a ranked list
- Reach is a real count: the only input drawn from data rather than judgment
- Fixed Impact scale: 3 / 2 / 1 / 0.5 / 0.25, deliberately narrow
- Confidence as an explicit discount: 100% / 80% / 50%, which few other frameworks include at all
- Effort in person-months, owned by the people doing the work
- Relative, not absolute: scores compare within one list and mean nothing outside it
- Auditable: a month later you can see exactly which input drove the decision
Worked example
Where the ranking came from
An illustrative composite. A B2B scheduling product in Boise with about 9,000 active accounts, ranking four candidates for the next quarter. Reach is accounts affected per quarter, taken from usage data rather than estimated.
Reach × Impact × Confidence ÷ Effort. Confidence is a decimal: 80% is 0.8.
| Candidate | R | I | C | E | Score |
|---|---|---|---|---|---|
| Bulk calendar import | 6,200 | 1 | 0.8 | 2 | 2,480 |
| Recurring booking rules | 1,400 | 2 | 0.8 | 3 | 747 |
| Enterprise SSO | 90 | 3 | 1.0 | 4 | 68 |
| Redesigned mobile view | 3,100 | 0.5 | 0.5 | 5 | 155 |
What the score did, and what it could not do
Bulk calendar import won on Reach alone — a medium improvement for 6,200 accounts beat a massive one for 1,400. That comparison is exactly what RICE exists to make, and no 2x2 would have produced it, because both items feel equally worthwhile in a room.
The mobile redesign is the instructive row. It has the second-highest Reach and finished third, because Confidence at 50% and Impact at 0.5 both cut it. The team had no evidence that mobile was where accounts were struggling — and the honest response to a 50% Confidence score is usually to go and find out rather than to build.
Enterprise SSO scored 68 and was built first anyway. Two contracts worth roughly a quarter of new revenue were blocked on it. Nothing in the formula has a term for that, and this is the ordinary case rather than a failure — RICE ranks by return per person-month, and somebody still has to decide what overrides the ranking.
When to Use
- When the ranking has to be defended to a board, an executive or a customer
- Comparing a small improvement for everybody against a large one for a few — the case RICE was built for
- When you have usage data good enough to produce a real Reach figure
- Quarterly planning with a list of roughly ten to thirty candidates
- When estimates vary wildly in quality and Confidence needs to be visible in the output
- As a second pass over the top-left quadrant of a Value vs Effort Matrix
- When last quarter’s decisions cannot be reconstructed and you want an audit trail
When NOT to Use
- Without usage data — a scored Reach makes the whole formula theatre; use Value vs Effort instead
- For strategic, contractual or compliance items, which have no term in the formula
- When dependencies drive the order: RICE ranks items as though they were independent
- Against a fixed deadline, where the question is scope rather than order — use MoSCoW
- For very small lists, where the arithmetic costs more than the argument it replaces
- When the list itself is unvalidated — validate with Kano before ranking guesses precisely
In practice
How RICE goes wrong
RICE fails quietly, because a broken implementation produces the same confident-looking ranked list as a sound one.
| What you see | What it usually means | What to do |
|---|---|---|
| Reach is scored 1–10 | The data was not available, or nobody insisted | Restore it as a count with a time period. If no data exists, that is worth knowing on its own — and it means RICE is the wrong tool this quarter. |
| Every Confidence is 100% | The term is being treated as a formality | Force at least a rough split. If nothing on the list is uncertain, the estimates have not been examined. |
| Effort estimates come from the roadmap owner | The denominator is being set by the person with a preference | Give Effort to the delivery team, scored without sight of the Reach and Impact figures. |
| Scores from different quarters compared directly | Treated as an absolute measure | Rescore the whole list together. RICE is ordinal within one exercise; a score of 300 last quarter and 300 this quarter are not the same claim. |
| Reach keeps growing between drafts | The score is being gamed | Reach is linear and unbounded, so it is the highest-leverage input to inflate. Require a data source next to every Reach figure. |
| Strategic work always ranks last | The framework is being asked to decide something it cannot see | Expected. Set aside capacity for strategic and compliance work outside the ranking rather than distorting Impact to force it up. |
| The ranking is followed exactly | Dependencies are being ignored | Check the top of the list for items blocked by things further down. RICE scores candidates as though they were independent, and they rarely are. |
Sourced
Evidence, and how to cite it
One author, one company, one post — unusually traceable for a prioritization method.
Sean McBride developed RICE at Intercom in 2016 and the company published it on its product blog. Compare this with the value vs effort matrix, which has no identifiable originator at all, or MoSCoW, whose numeric guidance comes from a different source than its author. If you need to cite RICE, there is a single correct thing to cite.
McBride, S. (2016) ‘RICE: Simple prioritization for product managers’. Intercom product blog.
Dividing by Effort puts the least reliable estimate in the worst position.
Effort is the denominator, and software effort estimation has a long-documented optimism bias. Underestimating effort inflates the score, and the underestimate is largest for the most complex items — so the error systematically favors exactly the work most likely to overrun. The formula gives no way to express uncertainty about Effort, since Confidence discounts Reach and Impact only.
Because it is arithmetic, it can be gamed, and Reach is where.
Impact is capped at 3 and Confidence at 1.0, so neither can move a score far. Reach is linear and unbounded, which makes it the efficient place to apply pressure. Teams learn this quickly without anyone deciding to cheat: the definition of “affected” simply widens between drafts. Requiring a named data source beside each Reach figure is the cheapest defense.
There is no research base, and the framework does not claim one.
RICE is a practitioner heuristic published on a company blog. No peer-reviewed work tests it against alternatives, and confident claims about its effect on outcomes come from vendors and consultancies rather than studies. Its design rationale is sound and its arithmetic is transparent, which is a fair basis for using it — but it belongs in the same evidential category as OKR and ADKAR rather than alongside methods with literature behind them.
How to cite it.
Harvard: McBride, S. (2016) ‘RICE: Simple prioritization for product managers’, Inside Intercom. Available at: intercom.com (Accessed: date).
APA: McBride, S. (2016). RICE: Simple prioritization for product managers. Intercom.
Note: cite the Intercom post rather than a secondary explainer. Most of the variation you will find in Impact and Confidence scales comes from third-party retellings, not from the original.
Key Strengths
- Produces a defensible ranking: a number, and a visible reason for it
- Confidence is built in: uncertainty appears in the output rather than in the corridor conversation
- Compares unlike things: a small win for everyone against a large win for a few
- Auditable: you can reconstruct a decision months later and see which input drove it
- Reduces seniority effects: harder to overrule a number than a preference
Key Weaknesses
- Needs usage data; without it, Reach becomes an opinion and the formula becomes decoration
- Effort sits in the denominator, where optimism does the most damage
- Gameable through Reach, which is unbounded while the other inputs are capped
- No term for strategy, compliance, contracts or time sensitivity
- Treats candidates as independent, so dependencies must be handled separately
- False precision: three decimal places on four estimates
How It Works
| 1 Primary Input | List of features or initiatives to prioritize |
|---|---|
| 2 Data You Need | Numerical estimates for Reach, Impact, Confidence, and Effort for each item |
| 3 Primary Output | Single score per item, enabling a ranked priority list |
Comparison with Related Frameworks
RICE Score is one of several quantitative prioritization frameworks. Here's how it compares to similar approaches:
RICE vs MoSCoW
MoSCoW Prioritization is much faster (2-3 hours vs 1-2 weeks) but uses categorical buckets instead of numerical scores. Use RICE if you want objective rankings with data, use MoSCoW if you need quick scope clarity.
RICE vs Value vs Effort
Value vs Effort Matrix is simpler and faster, but less rigorous than RICE. Use Value vs Effort for quick visual prioritization, RICE for more structured evaluation with detailed estimates.
RICE vs ICED
ICED Prioritization is very similar to RICE but adds a "Delight" factor for capturing customer excitement. Use ICED if you want to explicitly prioritize delightful features, RICE for balanced feature ranking.
RICE vs Kano Model
Kano Model takes a fundamentally different approach using customer research instead of team estimates. Use Kano for customer-driven insights, RICE for team-driven prioritization with existing data.
RICE vs Priority Matrix
Priority Matrix is even simpler than Value vs Effort, using just two axes and quadrant placement. Use Priority Matrix for quick team alignment, RICE for detailed quantitative ranking.
Sequencing
What to run before and after
RICE ranks a list it did not create and does not schedule. It is a middle step, and it is most often misused by being asked to be the whole process.
Before
Validate the candidates and find the Reach data
Ranking unvalidated ideas precisely produces a precise ranking of guesses. Establish that the items matter, and check you can produce a real Reach count, before committing to the arithmetic.
During
Score inputs separately, then rank the whole list at once
Reach from data, Impact and Confidence from whoever owns the outcome, Effort from the delivery team without sight of the rest. Score every candidate in one sitting so the numbers are comparable.
After
Apply what the formula cannot see, then sequence
Set aside strategic and compliance work, check the top of the list for items blocked by things below it, and decide what actually ships against the deadline.
Part of a playbook: How to Prioritize Product Features. RICE is stage 3 of 5, after the Kano Model and before MoSCoW.
Common questions
RICE: quick answers
What is the RICE score formula?
RICE = (Reach × Impact × Confidence) ÷ Effort. Reach is a count of how many people or accounts are affected in a stated period, Impact is a fixed multiplier of 3 for massive, 2 for high, 1 for medium, 0.5 for low or 0.25 for minimal, Confidence is a percentage of 100, 80 or 50, and Effort is person-months. Reading the units out loud tells you what the output is: expected impact per person-month of work, discounted for uncertainty.
What does RICE stand for?
Reach, Impact, Confidence and Effort. The first three are multiplied together and the result is divided by the fourth. The order in the acronym is not the order of importance, but it is worth knowing that Reach is the only one of the four that is supposed to come from data rather than judgment, and Effort is the only one in the denominator, which is where estimation error does the most damage.
Who created the RICE scoring model?
Sean McBride, a product manager at Intercom, developed it in 2016, and Intercom published it on its product blog. That post is the primary source and is worth citing directly rather than a secondary explainer, because most of the variation you will find in the Impact and Confidence scales comes from third-party retellings rather than from the original. It was built to solve one specific problem: comparing a small improvement affecting everybody against a large improvement affecting a few.
How do you calculate Reach in RICE?
As an actual count over a stated time period, taken from data you already hold: accounts affected per quarter, sessions per month, support tickets per release. This is the single most important discipline in RICE and the most commonly broken one. If Reach is scored one to ten alongside the other inputs, the formula is multiplying three opinions and dividing by a fourth, and the decimal places in the output are doing persuasive work the inputs cannot support.
What is a good RICE score?
There is no such thing in absolute terms. RICE scores are only meaningful relative to other scores computed with the same definitions, in the same list, at the same time. A score of 300 this quarter and 300 last quarter are not the same claim, because the lists and the assumptions differ. Rescore the whole list together each cycle and read the ordering rather than the numbers.
What is the difference between RICE and the value vs effort matrix?
RICE produces a single ranked list with a number behind each row; the value vs effort matrix places items relative to each other on two axes and produces four groups. RICE needs four estimates per candidate and real usage data for Reach, and gives you something you can defend to a board. The matrix takes an afternoon and needs no data at all. They combine well in that order: plot everything on the matrix, then run RICE on the top-left quadrant only.
What are the limitations of RICE?
Three worth knowing. Effort sits in the denominator, so the well-documented optimism bias in effort estimation inflates scores most for the hardest work. Reach is linear and unbounded while Impact and Confidence are capped, which makes it the efficient place to game a score, usually by quietly widening the definition of affected. And there is no term for strategy, compliance, contracts, time sensitivity or dependencies, so strategic work reliably ranks last and has to be set aside outside the model.
Is RICE research-based?
No, and it does not claim to be. It is a practitioner heuristic published on a company blog in 2016. No peer-reviewed work tests it against alternative prioritization methods, and confident claims about its effect on outcomes generally come from vendors and consultancies rather than studies. Its design rationale is clear and its arithmetic is transparent, which is a reasonable basis for using it, but it belongs in the same evidential category as OKR and ADKAR.
Deep Resources
Frameworks related to RICE Score
- MoSCoW PrioritizationA simple categorical system that classifies requirements as Must have, Should have, Could…
- Value vs Effort MatrixA visual 2×2 matrix that plots initiatives by their expected value and required effort,…