ICE Scoring: Impact, Confidence and Ease, and When to Use RICE Instead
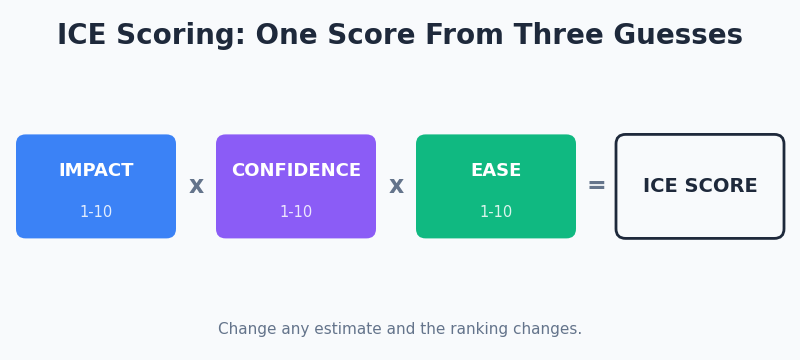
ICE Scoring is a prioritization method that rates each idea on three factors, Impact, Confidence and Ease, and multiplies them into a single score used to rank a list.
Before you start
Is this your framework?
ICE answers one question: given a long list of things we could do, which order should we try them in. It is fast, rough, and honest about being rough.
It is a triage tool. Nothing in it accounts for how many people an idea reaches, for dependencies, or for whether the list contains the right ideas at all. The table below routes to what does.
| If your real problem is… | You probably want |
|---|---|
| We need a ranking we can defend to stakeholders, and reach differs a lot between items | RICE — adds Reach and divides by Effort, slower and more defensible Compare ICE and RICE |
| We need to fix what is in and out of a release, not rank a list | MoSCoW — categorical scope control for negotiating a delivery boundary Compare ICE and MoSCoW |
| We want to know which features customers would actually be delighted by | Kano Model — researched with customers rather than estimated in a room |
| We are weighing benefit against work and want it visual, not numeric | Value vs Effort Matrix — the same trade-off as a two-by-two |
| The question is where our attention goes this week, not what to build | Eisenhower Matrix — urgency against importance, a different axis pair entirely |
| We do not know what belongs on the list, or what users are trying to achieve | User Story Mapping — build the list before ranking it |
| We have thirty ideas, similar in size, and need a rough order by Friday | ICE Scoring — you are in the right place |
What Is It?
Score each idea one to ten on how much it would move the thing you care about, one to ten on how sure you are it will work, and one to ten on how easy it is. Multiply. Sort by the result. That is the whole method, and it takes about a minute per idea once a team has agreed what the scales mean.
It came out of growth experimentation, where the list is long, the items are small and similar in size, and the cost of getting the order slightly wrong is low. Those conditions matter. ICE is built for triage, not for defending a decision.
The multiplication is what makes it useful and what makes it fragile. Multiplying means a weak score anywhere drags the whole thing down, which is usually the behavior you want: an enormous idea nobody believes in should not outrank a decent idea that will certainly work. But it also means small changes to any input move the ranking, and all three inputs are guesses.
Confidence is the factor that does the real work, and the one most often filled in carelessly. It is the only one that asks about evidence rather than about the idea, so it is where a team's actual knowledge enters the calculation. Scored honestly, it demotes the appealing ideas nobody has checked. Scored as enthusiasm, ICE becomes a ranking of how much people like things.
Worth saying plainly: the number is not a measurement. It is a way of making three separate judgments explicit and combining them the same way for every item, which is a real improvement on arguing about a list. Treat the output as a starting order to discuss, not a result.
Quick Reference
The factors
Scoring each factor honestly
Most of what goes wrong with ICE happens at the point of scoring, not in the arithmetic. Each factor asks something different and fails differently.
| Factor | What it should ask | How it goes wrong |
|---|---|---|
| Impact 1-10 | If this works exactly as hoped, how much does it move the one outcome we have named? | Scored against no named outcome, so every idea is impactful in its own terms. Name the metric before scoring anything. |
| Confidence 1-10 | What evidence do we have that it will work? A prior test, a similar case, research, or nothing. | Scored as enthusiasm. This is the factor that carries the team's knowledge, and treating it as a mood turns the whole score into a popularity ranking. |
| Ease 1-10 | How little work is it? Ten is easiest. | Scored the wrong way round by anyone used to Effort in RICE, which inverts the ranking silently for those rows. |
Anchor the scale before anyone scores
The commonest symptom of a useless ICE session is that every score lands between five and eight, so the products cluster and the ranking is decided by rounding. The fix is to pick the highest and lowest item on each factor first, as a group, and score everything else relative to those two anchors. It takes ten minutes and it is the difference between a spread and a smear.
Second habit worth keeping: score independently, then compare, and discuss only the items where people are far apart. A four-point gap on Confidence is not noise to be averaged away. It means two people disagree about what the evidence says, and that disagreement is more valuable than any number the session produces.
Choosing
ICE, RICE, and the ICED question
ICE sits in a family of scoring methods that differ in what they count and how they combine it. Choosing between them is mostly about how much you will have to defend the answer.
| Method | Formula | Choose it when |
|---|---|---|
| ICE | Impact × Confidence × Ease | The list is long, items are similar in size, and a rough order this afternoon beats a defensible one next week. |
| RICE | (Reach × Impact × Confidence) ÷ Effort | Reach differs a lot between items, or somebody will ask why their idea was cut. Slower, and the extra factor is the one ICE most often misses. |
| Value vs Effort | No formula; a two-by-two | You want the trade-off visible in a picture rather than compressed into a number. |
| ICED | Disputed — see below | Establish what somebody means by it first. There is no settled definition, and at least two unrelated ones are in circulation. |
On ICED, and why this page is about ICE
This page previously described ICED as Impact, Confidence, Ease and Delight, attributed to the product management community around 2010. We went looking for a primary source and could not find one. The one published meaning of ICED we could trace is entirely different: Infrequency, Control, Engagement and Distinctiveness, a framework for growing products that people use rarely.
So the honest position is this. Adding a delight factor to a scoring model is a reasonable idea and some teams do it. But we cannot point you at who proposed it, when, or what the agreed scales are, and a framework reference that cannot do that is not much use. If you want customer delight in a prioritization decision, the Kano Model researches it rather than estimating it, and ICE handles the rest. If someone hands you ICED, ask which four words they mean.
Core Features
- Three factors, one scale: all scored one to ten, so the product means something
- Multiplication, not addition: a weak score anywhere pulls the whole thing down
- Ease, not effort: higher is easier, the opposite of RICE's denominator
- Anchored scales: highest and lowest named before anything else is scored
- Independent scoring: compared afterward, with the disagreements discussed
- A named outcome: Impact is meaningless until you say impact on what
Worked example
Twenty-two ideas, and four disagreements worth more than the ranking
An illustrative composite. A subscription meal-kit business in Santiago, Chile, with a growth team of five. Twenty-two experiment ideas had accumulated and the weekly prioritization meeting had become an argument. They scored the list with ICE.
| Stage | What it showed |
|---|---|
| First pass | Every item scored between 5 and 8 on all three factors. Scores ran from 125 to 448 and the top eight were within 40 points of each other, which is well inside the noise of a guess. The ranking was decided by rounding. |
| Anchoring the scales | The group named the single highest-impact and lowest-impact idea on the list before rescoring, and did the same for Ease. Scores then ran from 8 to 720, and the top three separated clearly. |
| Where they disagreed | Confidence was scored independently. On four of the 22 items the spread between team members was five points or more. Every one of those four turned out to rest on a belief about customer behavior that nobody had tested. |
| What the score missed | The top-ranked item affected only subscribers already on the annual plan, about 4% of the base. Nothing in ICE asks how many people an idea touches. Adding Reach dropped it to seventh. |
| What they ran | The four high-disagreement items were converted into cheap tests of the underlying belief rather than full experiments. Two of the beliefs turned out to be wrong, which removed six ideas from the backlog entirely. |
The disagreements were worth more than the ranking
The ordered list was useful and unremarkable. The finding was the four items where Confidence scores were five points apart. Each marked a place where the team held an untested assumption and did not know they disagreed about it — and two of those assumptions were false, which cleared six ideas off the list without running any of them.
Note the other lesson. The idea ICE ranked first reached 4% of customers, because reach is not in the formula. That is not a flaw in ICE so much as its stated scope, and it is exactly the condition under which RICE is worth the extra time. When the items on your list differ wildly in how many people they touch, ICE will mislead you confidently.
When to Use
- A long list of similar-sized ideas needs a rough order quickly
- Growth or product experiments, which is what the method was built for
- Items reach broadly similar numbers of people
- The cost of getting the order slightly wrong is low and reversible
- A meeting keeps re-arguing the same list and needs a shared method
- As a first pass before a more defensible scoring exercise
When NOT to Use
- Reach varies enormously between items, which ICE cannot see
- The decision will be challenged and has to be defended in detail
- Items differ hugely in size, so Ease stops being comparable
- Dependencies matter, since nothing in the score represents them
- The list itself is wrong, and the real work is finding what is missing
- A single large irreversible commitment, where a rough score is no help
Choosing
How the scoring goes wrong
The arithmetic almost never fails. The scoring does, and the single number hides it well.
| Failure mode | What it looks like | What to do instead |
|---|---|---|
| Everything scores 5 to 8 | Products cluster, the top items are within noise of each other, and rounding decides | Anchor each scale to the highest and lowest item on the list before scoring the rest. |
| Confidence as enthusiasm | The ideas people like score high, and the score becomes a popularity ranking | Make Confidence cite evidence: a prior test, a similar case, research, or nothing. |
| Ease scored as effort | Hard items score high because someone inverted the scale, silently reversing those rows | Write the direction at the top of the sheet. Ten is easiest. |
| Averaging the disagreements | A four-point Confidence gap becomes a middling number and the disagreement disappears | Score independently. Discuss only where the spread is wide; that is where the value is. |
| Reach ignored | A high-scoring idea that affects a tiny fraction of users beats a modest one affecting everybody | Switch to RICE when reach varies. This is the specific gap ICE leaves. |
| The score becomes the decision | The ranking is executed rather than discussed, and nobody revisits a bad estimate | Treat it as an agenda for a conversation. Re-score after anything is learned. |
| Scoring a list nobody questioned | An efficient ranking of the wrong twenty ideas | Ask what is missing before scoring. A score cannot surface an absent option. |
Sourced
Evidence, and how to cite it
ICE is attributed to Sean Ellis, and comes from growth experimentation.
Ellis, who coined the term growth hacking, developed the model to prioritize a continuous flow of growth experiments, where the value of a fast rough order outweighs the value of a precise one. It spread through the growth community from around 2010 and was later adopted for general feature prioritization. There is no canonical paper: it is a practitioner method popularized through writing and practice, and worth citing as such rather than as a research result.
Attributed to Sean Ellis; disseminated through growth-hacking practice and subsequently adopted in product management tooling.
We could not find an independent source for ICED as Impact, Confidence, Ease and Delight.
This page previously carried that definition, attributed to the product management community around 2010. Searching for a primary source returned nothing beyond this site's own earlier page. The one traceable published use of ICED in product management is unrelated: Infrequency, Control, Engagement and Distinctiveness, proposed for growing products that people use infrequently. Adding a delight factor to a scoring model is a sensible thing to do and some teams do it, but we cannot tell you who proposed this version, when, or what the agreed scales are. The page has been rewritten around ICE, which is attributable.
Search conducted August 2026; no primary source located for the four-factor Delight variant. For customer delight assessed rather than estimated, see the Kano Model.
Multiplying three estimates produces a number more precise than its inputs.
Each factor is a judgment on a coarse scale, and the product of three such judgments inherits all their uncertainty while looking like a measurement. A score of 384 against 360 is not a meaningful difference, but it sorts as one. This is a general property of composite scores rather than a flaw peculiar to ICE, and the practical consequence is the same: treat adjacent scores as ties and spend the argument on the gaps that are large.
General property of multiplicative composite indices; see also the discussion of estimate reliability on the RICE page.
There is no evidence that scoring frameworks produce better decisions.
No controlled comparison shows that teams using ICE, RICE or any similar model outperform teams that discuss and decide. What these methods reliably do is make the basis of a decision explicit and consistent across items, which shortens arguments and leaves a record of what was assumed. That is worth having. It is a different claim from the one usually made for them, and the honest reason to use one is the conversation it forces rather than the ranking it outputs.
Assessment of the product management literature as of 2026; no controlled outcome studies of prioritization scoring are available.
How to cite it.
Harvard: there is no single canonical publication. Cite as: Ellis, S. (c. 2010) The ICE scoring model, developed for growth experiment prioritization.
For RICE, cite Intercom's published account of the model. For delight assessed with customers, cite Kano, N. (1984). Do not cite ICED without first establishing which definition your source is using.
Key Strengths
- Fast: about a minute an item once the scales are agreed
- Forces three separate judgments: which a discussion tends to blur together
- Multiplication punishes weak links: an unbelieved big idea does not float to the top
- Surfaces disagreement: the spread on Confidence is the most useful output
- Nothing to learn: a team can use it correctly the first time
Key Weaknesses
- Blind to reach: the specific gap RICE exists to fill
- Scores cluster: without anchoring, everything lands mid-scale
- Looks more precise than it is: three guesses, one confident-looking number
- Ease is easy to invert: silently reversing part of the ranking
- Cannot see what is missing: it ranks the list it is given
Sequencing
What to run before and after
A score orders a list. It does not produce one, and it does not tell you whether the order was right.
Before
Build the list, and name the outcome Impact refers to
Impact is meaningless until you have said impact on what. And a ranking cannot surface an option nobody wrote down, so it is worth checking what is missing before scoring anything.
During
Score independently, then argue about the gaps
The ranking is the lesser output. Where Confidence scores are far apart, the team is disagreeing about evidence, and turning that into a cheap test is usually worth more than running the top-ranked item.
After
Fix the scope boundary, and re-score when you learn something
A ranked list still needs a line drawn across it for a given release. And every estimate in the score was a guess that new information should update.
Common questions
ICE scoring: quick answers
What is ICE scoring?
A prioritization method that scores each idea on Impact, Confidence and Ease, typically one to ten, and multiplies the three into a single number you can sort on. It was popularized by Sean Ellis for prioritizing growth experiments, and is now used more broadly for features and projects.
What does each ICE factor mean?
Impact is how much this moves the outcome you care about, if it works. Confidence is how sure you are that it will work, which should rest on evidence rather than enthusiasm. Ease is how little effort it takes, scored so that higher is easier. Getting Ease the right way round matters: it is multiplied, not divided.
What is the difference between ICE and RICE?
RICE adds Reach, how many people are affected, and divides by Effort instead of multiplying by Ease. That makes RICE slower and more defensible, and better when you have to justify what you cut. ICE is faster and rougher, and better for triaging a long list of small experiments where reach is roughly similar across them.
What does ICED mean?
It depends who is using it, and we could not find a settled definition. One published usage is Infrequency, Control, Engagement and Distinctiveness, a framework for growing products people use rarely, which is unrelated to scoring a backlog. Some sources describe a four-factor variant of ICE that adds Delight, but we found no primary source for it. If you have been given ICED as a method, ask which of these is meant before using it.
Is a higher or lower ICE score better?
Higher. All three factors are scored so that more is better, including Ease, where ten means easiest rather than hardest. This trips people up because Effort in RICE runs the other way, and a team that mixes the two conventions in one spreadsheet will produce a ranking that is exactly backwards for some rows.
Why do ICE scores end up all the same?
Because people score toward the middle. If everything lands between five and eight on each factor, the products cluster and the ranking is decided by rounding. Force the range: make somebody name the highest and lowest item on each factor first, and score the rest relative to those anchors.
Should ICE scores be averaged across a team?
Averaging hides the thing worth looking at. Where two people score Confidence four apart, that gap is information about a disagreement over evidence, and averaging it to a middling number discards it. Score independently, then discuss only the items where the spread is wide.
How do you cite ICE scoring?
There is no single canonical paper. ICE is attributed to Sean Ellis, who developed it for prioritizing growth experiments and popularized it through his writing and the growth-hacking community from around 2010. For RICE, cite Intercom's published account. Both are practitioner methods rather than research results, and worth citing as such.
Deep Resources
Frameworks related to ICE Scoring
- RICE ScoreAdds Reach and divides by Effort — the model to switch to when reach varies…
- Kano ModelCustomer delight researched rather than estimated, which is what a Delight factor gestures at…
- MoSCoW PrioritizationCategorical scope control for when the question is in or out, not what order…