Playbook
How to Prioritize Product Features
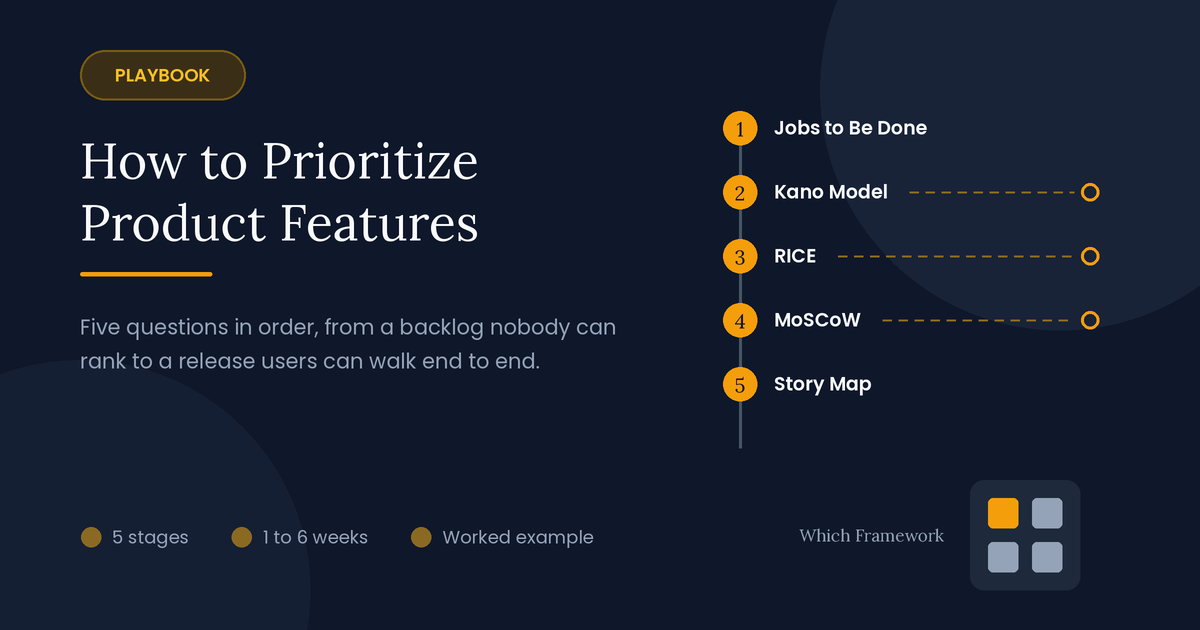
Five questions, asked in order, for deciding which features to build next.
A feature prioritization playbook is a five-stage sequence of product tools that turns a long backlog of ideas into a ranked, scoped release built around the job customers hire the product for.
The route
Five questions, in order
Each stage asks one question and uses one proven tool to answer it. What comes out of each stage goes into the next. Three points on the route can stop an idea, send you to do research, or force a cut.
Already sure what customers need, and only need to cut a release? Start at stage 4.
-
What job is the product hired for?Stage 1 · Jobs to Be Done
Passes on: the job, and a backlog cut down to ideas that serve it
-
Which features matter, and how?Stage 2 · Kano Model
Passes on: each idea sorted by how it affects satisfaction
Basics not met?Fix them first, outside the ranking.
-
Which ideas give the most for the effort?Stage 3 · RICE Score
Passes on: a ranked list, with the guesses marked
Top ideas rest on a guess?Test before you commit.
-
What goes in this release?Stage 4 · MoSCoW
Passes on: a scoped release, including what is left out
Musts over 60% of the effort?Move some down; the release needs slack.
-
In what order do users get it?Stage 5 · User Story Mapping
Passes on: release slices a user can walk end to end
- How do you know it worked?Then · Measure, then repeat each quarter
The example
One product, followed all the way through
This playbook follows one product team from start to finish. It is an illustrative composite, and the details are simplified.
A 60-person software company in Istanbul sells invoicing software to small businesses across Turkey. About 4,000 businesses pay for it. The backlog has more than 200 ideas, sales wants whatever the last lost customer asked for, and the team has about 8 person-months of work to spend next quarter. Nobody can say why one idea beats another.
Each stage below ends with what the team produced at that step, so you can watch one stage's output become the next stage's input.
Stage 1 of 5
What job are customers hiring the product for?
Tool: Jobs to Be Done · Time: 1 to 2 weeks
Start with the customer, not the backlog. Jobs to Be Done asks what people are trying to get done when they use your product, the way they would describe it themselves. Talk to ten to fifteen customers about the last time they used it for something that mattered, and listen for the situation, the goal and what they used before.
Write the job as one sentence in three parts: when (the situation), I want to (the goal) and so I can (the result). Then read the backlog against it. Ideas that don't serve the job leave the list now, before anyone spends time scoring them.
What goes inCustomer interviews, and the current backlog.
What comes outOne job statement customers recognize, and a shorter backlog of ideas that serve it.
Skip it if: you ran job interviews in the last six months and the product hasn't changed direction since.
The job, as customers described it
Job statementGet paid on time without chasing
- Whena client pays late and my own bills are due
- I want tosee who owes what, and remind them, in one place
- So I cankeep cash coming in without spending my evenings on it
| Idea | Serves the job? |
|---|---|
| Reliable e-invoice sending to the tax system | Yes. Without it, they can't invoice at all |
| Automatic late-payment reminders | Yes, directly |
| A who-owes-what dashboard | Yes, directly |
| Bank feed that matches payments to invoices | Yes |
| Invoices in euros and dollars | Yes, for customers who export |
| AI-written invoice descriptions | Barely |
| Dark mode | No |
Handed to stage 2: the job, and the seven ideas above. The same test cut the full backlog of more than 200 to 31. The page follows these seven.
Stage 2 of 5
Which features matter, and in what way?
Tool: Kano Model · Time: 1 to 2 weeks
Not every idea affects customers the same way. The Kano Model sorts features into five categories by how their presence, and their absence, change how satisfied people feel.
The method is a pair of questions for each feature. How would you feel if the product had it? How would you feel if it didn't? A standard table turns the two answers into a category. Ask the customers who fit the job from stage 1, and check whether different groups answer differently.
What goes inThe ideas that survived stage 1.
What comes outEach idea in a category, and a list of basics the product fails today.
Skip it if: the ideas are all small improvements to features customers already rate. Go to stage 3.
- MMust-be
- Expected. Missing makes people angry; present, nobody notices
- OOne-dimensional
- More is better. Satisfaction rises the better it works
- AAttractive
- A pleasant surprise. Nobody misses it until they have it
- IIndifferent
- Nobody cares either way
- RReverse
- Some people would rather not have it
The question pair, asked for one idea
IdeaAutomatic late-payment reminders
- If the product had it, how would you feel?I'd like it
- If it didn't, how would you feel?I'd dislike it
- CategoryOne-dimensional: people want it, and they miss it when it's gone
| Idea | Category | What it means |
|---|---|---|
| Reliable e-invoice sending | Must-be | Fails on about 1 in 50 sends today. That is a broken basic |
| Late-payment reminders | One-dimensional | The better they work, the happier people are |
| Who-owes-what dashboard | One-dimensional | Same |
| Bank feed matching | Attractive | Nobody asks for it; everyone who tried it loved it |
| Invoices in euros and dollars | Attractive for exporters | Indifferent for everyone else |
| AI-written descriptions | Indifferent | Dropped |
| Dark mode | Indifferent | Dropped |
Handed to stage 3: the broken basic goes straight into the release, outside the ranking. The four one-dimensional and attractive ideas go on to be ranked. The two indifferent ones are dropped.
Decision point
If a must-be basic is failing, fix it before anything else. Don't rank it against the other ideas. No delight feature makes up for a basic that breaks, and customers leave over basics long before they leave over missing extras.
Stage 3 of 5
Which ideas give the most for the effort?
Tool: RICE Score · Time: 2 to 3 days
Now rank what is left. RICE gives each idea a score from four estimates and puts every idea on the same scale, so a small fix for many customers can be compared with a big feature for a few.
Impact uses a fixed scale: 3 for massive, 2 for high, 1 for medium, 0.5 for low and 0.25 for minimal. Confidence is 100% when you have data, 80% when you have some evidence, and 50% when it is mostly a guess. The confidence score is the one to watch. It tells you which part of the ranking to trust.
Measure reach over the same period for every idea, usually a quarter, or the scores can't be compared. And count effort for the whole team, including design and testing, not just coding time.
What goes inThe one-dimensional and attractive ideas from stage 2.
What comes outA ranked list, with the low-confidence scores marked.
Skip it if: you have fewer than five ideas, or no time. Use the Value vs Effort matrix instead.
- RReach
- How many customers it affects in a set period
- IImpact
- How much it helps each one: 3, 2, 1, 0.5 or 0.25
- CConfidence
- How sure you are: 100%, 80% or 50%
- EEffort
- Person-months of work to build it
The formula, worked for one idea
RICE score(Reach × Impact × Confidence) ÷ Effort
- Late-payment reminders1,800 customers a quarter × 2 × 80% ÷ 2 person-months = 1,440
| Idea | Reach | Impact | Confidence | Effort | Score |
|---|---|---|---|---|---|
| Late-payment reminders | 1,800 | 2 | 80% | 2 | 1,440 |
| Who-owes-what dashboard | 2,400 | 1 | 80% | 3 | 640 |
| Bank feed matching | 1,200 | 3 | 50% | 6 | 300 |
| Invoices in euros and dollars | 300 | 2 | 80% | 2 | 240 |
Handed to stage 4: reminders first, then the dashboard. Bank feed matching has the highest impact but is only a guess, so it goes to a two-week test with ten customers instead of six person-months of build.
Decision point
If a top-ranked idea sits at 50% confidence, test it before you commit. A week of customer tests costs far less than building the wrong thing, and the score will move once you know.
Stage 4 of 5
What goes in this release, and what doesn't?
Tool: MoSCoW · Time: half a day
A ranking says what matters most. It doesn't say what fits. MoSCoW sorts the ranked ideas into four groups for one release: Must have (the release fails without it), Should have (important, but the release still works without it), Could have (the first thing to drop if time runs short) and Won't have this time.
Two rules keep it honest. Keep the Musts to about 60% of the effort, so there is room for things to go wrong. And write the Won't list down and share it. Saying no out loud is what stops the same requests coming back every week.
What goes inThe ranked list from stage 3, the fixed basics from stage 2, and the team's capacity.
What comes outA scoped release, with what is left out stated plainly.
Skip it if: you release continuously and don't plan work in fixed releases.
MMust have
- Fix e-invoice sending1 person-month
- Late-payment reminders2 person-months
3 of 8 person-months (38%)
SShould have
- Who-owes-what dashboard3 person-months
3 of 8 person-months
CCould have
- Invoices in euros and dollars2 person-months; first to drop
2 of 8 person-months
WWon't have (this time)
- Bank feed matchingTesting first
- AI descriptionsIndifferent
- Dark modeIndifferent
Shared with sales
Handed to stage 5: a release of 8 person-months, with the Musts at 38%. Invoices in euros and dollars are first to go if anything slips.
Decision point
If the Musts take more than about 60% of the effort, move some down. A release that is all Musts has no slack, so the first surprise breaks a promise instead of dropping a Could.
Stage 5 of 5
In what order do users get it?
Tool: User Story Mapping · Time: 1 day
The last question is order. A user story map lays out what the user does, step by step, as a row of activities across the top. Under each activity sit the pieces of work that support it, most necessary at the top.
Then draw lines across the map to cut releases. The first slice should let a user walk the whole journey from start to finish, even if every step is basic. A release that perfects one step and leaves the next one missing gives users nothing they can use.
Read the map left to right to check the journey, and top to bottom to check the order. If a release leaves a gap in the top row, users will hit it on their first day. Fill it before adding depth anywhere else.
What goes inThe scoped release from stage 4.
What comes outReleases in order, each one usable from start to finish.
Skip it if: the release is a single feature with no journey around it.
| Send the invoice | Track payment | Chase late payers | Record payment | |
|---|---|---|---|---|
| Release 1 (week 4) | e-invoice sending fixed | Due-date list, overdue first | One reminder, sent by hand | Mark as paid |
| Release 2 (week 8) | Invoices in euros and dollars | Who-owes-what dashboard | Automatic reminder schedule | Part payments |
| Later | – | – | SMS reminders | Bank feed matching, if the test works |
Handed on: release 1 ships in four weeks and lets a customer send, track, chase and record a payment, basically. Release 2 fills it out.
Pace
Fast track or thorough
The fast track suits a small team or a short cycle. The thorough run suits a product with many customers, where a wrong call is expensive.
| Stage | Fast track (about a week) | Thorough (4 to 6 weeks) |
|---|---|---|
| 1. Jobs to Be Done | Five calls and support tickets | Ten to fifteen full interviews |
| 2. Kano | The team sorts ideas from what it has heard | A Kano survey of customers |
| 3. RICE | Value vs Effort in one session | Full RICE, with reach from usage data |
| 4. MoSCoW | One planning meeting | Agreed with sales and support |
| 5. Story map | Sketched on a whiteboard | Built with design and engineering |
Failure modes
How feature prioritization goes wrong
| What happens | What it looks like | The fix |
|---|---|---|
| Scoring the whole backlog | Weeks spent scoring ideas nobody needs | Cut against the job in stage 1 first |
| Ranking basics against extras | A broken basic loses to a shiny feature | Fix failing must-be basics outside the ranking |
| Trusting false precision | A score of 300 beats 290 and nobody asks why | Read confidence first; test the guesses |
| Everything is a Must | No slack, so the release slips | Keep Musts to about 60% of the effort |
| Releases nobody can use | One step polished, the next one missing | Slice the story map so every release runs end to end |
After the playbook
Measuring it, and doing it again
Pick the measure that shows the job is being done better, and check it after each release. For the invoicing team that is how many days customers wait to get paid. Treat it as one of your KPIs, not a one-off check.
Run the playbook again each quarter. Kano categories drift: today's pleasant surprise is next year's basic. The job itself changes more slowly, so stage 1 can often be a quick check rather than a full round of interviews.
Common questions
Feature prioritization: quick answers
What is the best framework to prioritize product features?
No single one. Deciding what to build takes several decisions, and each has its own best tool. Jobs to Be Done says what the product is for, Kano sorts features by how they affect satisfaction, RICE ranks them, MoSCoW scopes the release and a story map sets the order. Used together, each covers what the others miss.
What is the difference between RICE and MoSCoW?
RICE ranks ideas by expected value for the effort. MoSCoW sorts ideas into what a single release must, should, could and won't include. Rank with RICE first, then use MoSCoW to decide what fits the next release.
How is the Kano Model used to prioritize features?
It sorts features into must-be, one-dimensional, attractive, indifferent and reverse, based on paired questions to customers. Its most useful finding is a basic the product fails today. That goes into the next release ahead of everything else, rather than being ranked against new features.
What if stakeholders say everything is a Must have?
Keep the Musts to about 60% of the release's effort and ask each stakeholder what they would drop to add theirs. A Must is something the release fails without. If the release would still ship and work without it, it is a Should.
Can I use Value vs Effort instead of RICE?
Yes, on the fast track. Value vs Effort is quicker and needs no numbers, which suits a small team. It gives up the confidence score, so it can't tell you which rankings rest on a guess.
How often should feature priorities be revisited?
Every quarter for the ranking and the release scope. The customer's job changes slowly, so stage 1 can be a quick check between full rounds. Re-run stage 2 at least once a year, because features drift from pleasant surprise to expected basic.
Frameworks in this playbook
- Jobs to Be DoneStage 1: What job are customers hiring the product for?
- Kano ModelStage 2: Which features matter, and in what way?
- RICE ScoreStage 3: Which ideas give the most for the effort?
- MoSCoWStage 4: What goes in this release, and what doesn't?
- User Story MappingStage 5: In what order do users get it?
- Value vs Effort MatrixFast track: a quicker stand-in for RICE
- KPIsAfter: checking the release did the job