Playbook
How to Plan a Project That Finishes on Time
Six questions, asked in order, for a project with a date it can't miss.
A project planning playbook is a six-stage sequence of planning tools that defines all the work, finds which work sets the finish date, and keeps the plan honest until the finish.
The route
Six questions, in order
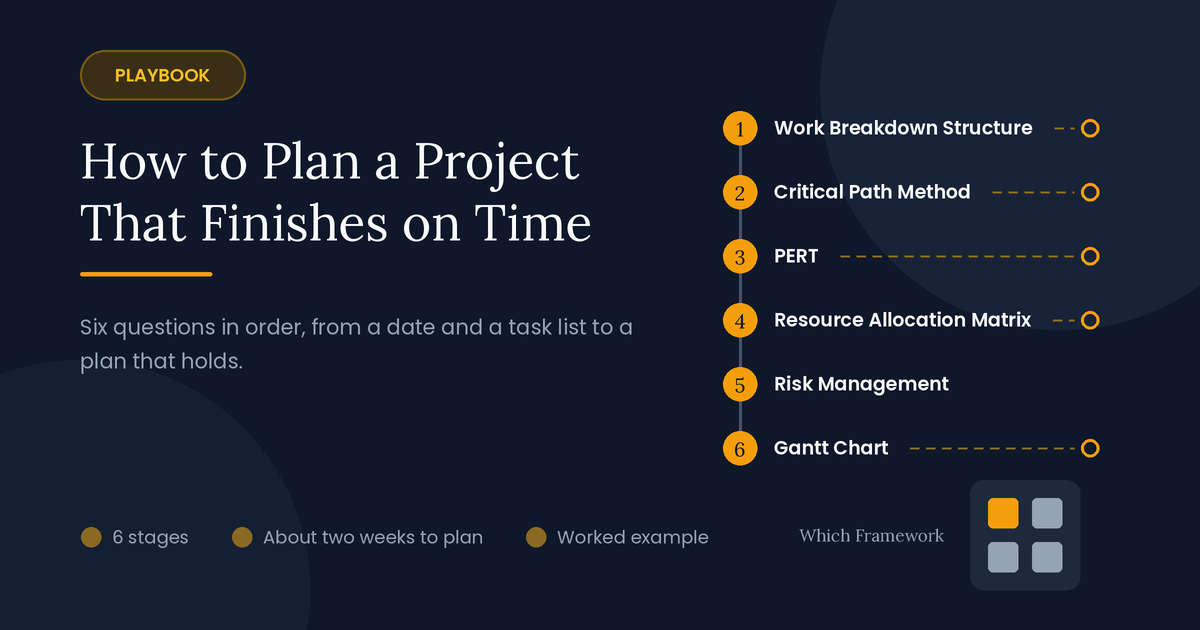
The route runs in the order a plan has to be built: the work, its order, the odds, the people, the risks, then the schedule everyone follows.
On timing: stages 1 to 5 are planning, about two weeks for a project of a few months. Stage 6 starts when the work does and runs to the finish.
Is the scope still changing week to week? Plan in short cycles with Agile Sprint Planning instead.
Free tools run each stage on your own project. The Project Planning Tool lays out all six stages and starts you off; or start at stage 1 with the Work Breakdown Structure Tool, or take the 15-minute guided tour first.
-
What is all the work?Stage 1 · Work Breakdown Structure
Passes on: every work package, each with one owner
Scope changing every week?Plan in short sprints instead.
-
Which work sets the finish date?Stage 2 · Critical Path Method
Passes on: the critical path, and the float on everything else
Critical path longer than the time you have?Shorten it on the path, nowhere else.
-
How sure is the date?Stage 3 · PERT
Passes on: an expected finish, and its odds
Odds too low?Buy time on the critical path now.
-
Is anyone booked twice?Stage 4 · Resource Allocation Matrix
Passes on: a load each person can carry
Anyone over 100% in a busy week?Move work that has float.
-
What could knock it off course?Stage 5 · Risk Management Framework
Passes on: risks with owners, and one shared buffer
-
Is it still on track?Stage 6 · Gantt Chart
Passes on: a schedule updated every week
Finish date never moves?Check for dates fixed by hand.
- Did it finish on time?Then · Compare actual with estimated
The example
One company, followed all the way through
This playbook follows one company from start to finish. It is an illustrative composite, and the details are simplified.
A furniture and homeware retailer in Lima, Peru, has one showroom and is opening a second in a new shopping center. The center opens in 22 weeks, and every tenant is expected to open with it. A store that opens late pays the center PEN 3,000 (Peruvian soles) a day, and misses the opening crowds in the weeks before Christmas.
Most of its stock comes from local furniture makers, its suppliers; its best-selling sofas are imported. The operations manager has a date and a task list from the kickoff meeting. Planning takes two weeks, leaving 20 for the work.
Each stage below ends with what the company produced at that step, so you can watch one stage's output become the next stage's input.
Stage 1 of 6
What, exactly, is all the work?
Tool: Work Breakdown Structure · Time: 3 to 5 days
Start with what the project has to produce, not with a task list. A work breakdown structure (WBS) divides the whole scope, level by level, into work packages: pieces small enough to estimate, give to one owner and track. Three rules make it work.
Three rules of a work breakdown structure
- 1The 100% rule
- The pieces under any item add up to all of its scope, no more and no less
- 2Nouns, not verbs
- Each item names something the project produces, such as Approved drawings
- 3Stop at the work package
- Small enough to estimate, give to one owner and track as a unit
Build it top down with the people who will do the work, then test every branch against the 100% rule: does what sits under it cover all of it? Missing work never shows up as an error. It shows up as a project that finishes late for reasons the schedule never mentioned.
| Branch (level 1) | Work packages, for example | Missing from the first task list |
|---|---|---|
| Fitted showroom | Approved drawings, finished building works, display fixtures | The center's design approval; the fire safety inspection; the city's operating license |
| Stock on display | Chosen range, supplier orders, imported sofas, stock in place | Customs clearance for the sofas |
| Trained team | Eight staff hired, training completed, uniforms | Nothing |
| Working systems | Till, card payments, stock system, network | The card payment contract, which takes three weeks |
| Opening campaign | Shop sign, launch offers, opening event | The center's approval of the sign |
Handed to stage 2: 31 work packages in five branches, each with an owner, including six the first task list had missed.
Decision point
If nobody can say what “done” means for a branch, stop and agree the scope first. A WBS organizes scope; it can't decide it. Here, the owner and the operations manager disagreed on whether the opening event was part of the project. It was, so it got a branch.
Stage 2 of 6
Which chain of work sets the finish date?
Tool: Critical Path Method · Time: 1 to 2 days
Next, put the work in order. The Critical Path Method lists each activity with what it must wait for, then finds the longest chain of dependent work from start to finish. The project can't finish before that chain does, so its length is the shortest the project can be.
Four terms the Critical Path Method works out
- 1Earliest start
- From the forward pass: the soonest an activity can start
- 2Latest start
- From the backward pass: the latest it can start without moving the finish
- 3Float
- The gap between the two, also called slack
- 4Critical path
- The chain of activities with zero float
Use one duration per activity for now, the most likely one. Then question the arrows, not just the durations: many dependencies are habits. The first network came to 21 weeks, one more than the company had, because display fixtures were to be made after the fire inspection. Made during the building works instead, and only fitted after it, they cut two weeks at no cost.
| Activity | Weeks | Waits for | Can start in week | Float, weeks |
|---|---|---|---|---|
| A. Store design drawn | 3 | – | 1 | 0 |
| B. The center's design approval | 3 | A | 4 | 0 |
| C. Building works | 8 | B | 7 | 0 |
| D. Display fixtures made | 6 | B | 7 | 3 |
| E. Fire inspection and license | 1 | C | 15 | 0 |
| F. Display fixtures fitted | 2 | D, E | 16 | 0 |
| G. Range chosen, orders placed | 2 | – | 1 | 3 |
| H. Sofas made and shipped | 10 | G | 3 | 3 |
| I. Customs clearance | 2 | H | 13 | 3 |
| J. Stock delivered and displayed | 2 | F, I | 18 | 0 |
| K. Staff trained in the showroom | 1 | F | 18 | 1 |
Handed to stage 3: a 19-week critical path through the fit-out, one week inside the 20 available, and three weeks of float on the imported sofas.
Decision point
If the critical path is longer than the time you have, shorten it on the path and nowhere else. Speeding up an activity with float buys nothing. Recalculate after every change, because the path can move.
Stage 3 of 6
How likely are you to finish by the date?
Tool: PERT · Time: 1 to 2 days
A single duration is a guess that looks like a fact. PERT asks for three: optimistic (O), most likely (M) and pessimistic (P). From them it works out an expected duration, and a standard deviation that measures how uncertain the activity is.
The imported sofas, worked
Expected duration (PERT)(O + 4M + P) ÷ 6
- Three estimatesOptimistic 8 weeks, most likely 10, pessimistic 18, from the supplier and the shipping agent
- Expected(8 + 4 × 10 + 18) ÷ 6 = 11 weeks
- Standard deviation(18 − 8) ÷ 6 = 1.7 weeks, the widest range of any activity
Run it on the critical path and on any path with little float. Add the expected durations along the path. For the path's uncertainty, add the squares of the standard deviations and take the square root. Together they give the odds of finishing by the date.
The critical path's most-likely total was 19 weeks. Its expected total is 20.5, give or take 1.3: about a one-in-three chance of opening on time.
| Activity | Optimistic | Most likely | Pessimistic | Expected |
|---|---|---|---|---|
| A. Store design drawn | 2 | 3 | 4 | 3.0 |
| B. The center's design approval | 2 | 3 | 7 | 3.5 |
| C. Building works | 7 | 8 | 12 | 8.5 |
| E. Fire inspection and license | 1 | 1 | 3 | 1.3 |
| F. Display fixtures fitted | 2 | 2 | 3 | 2.2 |
| J. Stock delivered and displayed | 1 | 2 | 3 | 2.0 |
Handed to stage 4: an expected finish of 18.3 weeks after a second building crew was hired, about four chances in five of opening on time, and the sofas as the least certain activity.
Decision point
If the odds are lower than you can accept, buy time on the critical path now, while it is cheap. A second building crew cost PEN 38,000, less than two weeks of penalties, and cut building works to 5, 6 and 9 weeks. Counting the sofas' path, now almost as long, the odds rose to about four in five.
Stage 4 of 6
Is anyone booked on two things at once?
Tool: Resource Allocation Matrix · Time: half a day, then weekly
The network assumes everyone is free when it needs them. A resource allocation matrix checks: people down one side, the work claiming them across the top, and in each cell the share of that person's time it takes. Read across a row to see how loaded one person is.
| Person | New showroom | Flagship's Christmas refit | Day-to-day work | Total |
|---|---|---|---|---|
| Visual merchandiser | 70% | 60% | 20% | 150% |
| Operations manager | 60% | 10% | 40% | 110% |
| Buyer | 20% | 30% | 40% | 90% |
| HR officer | 30% | 0% | 50% | 80% |
| New store manager | 90% | 0% | 0% | 90% |
Check the busiest weeks, not the average, and include work outside the project. Plan people at about 80%, not 100%; the rest absorbs illness, meetings and everything else. And name who decides between competing claims before the grid shows a clash.
Handed to stage 5: the visual merchandiser down from 150% to 90% and the operations manager to 80% in the busy weeks, with no date on the critical path changed.
Decision point
If someone is over 100% in a busy week, move work that has float, not work on the critical path. Setting up the displays had none. The flagship's refit could go four weeks earlier, and the owner, named in advance as the one who decides, moved it. The operations manager handed day-to-day work to a deputy.
Stage 5 of 6
What could knock the plan off course?
Tool: Risk Management Framework · Time: 1 to 2 days, then every two weeks
The schedule shows how long things take, not what might happen to them. Risk management lists the events that could knock the plan off course, scores each one, and gives it an owner and one of four treatments.
The four treatments for a risk
- 1Avoid
- Don't do the thing that carries the risk
- 2Reduce
- Lower the probability, the impact, or both
- 3Transfer
- Move the cost elsewhere, by contract or insurance. The delay still happens
- 4Accept
- Carry it on purpose, and watch it
Write each risk as a cause, an event and a consequence, so someone outside the room would recognize it. Keep spare time in one place. The plan's dates use most-likely durations and finish in week 17, so the three weeks before opening are one shared buffer, held by the operations manager; PERT expects about 1.3 of them to be used. Padding each activity hides it where it gets used up.
| Risk: cause, event, consequence | Score: P × I | Treatment and owner |
|---|---|---|
| A new customs broker; paperwork errors hold the sofas at the port; the showroom opens half empty | 12 | Reduce: the broker checks the papers before the ship sails. Owner: the buyer |
| Drawings use the old fire code; the inspection fails; weeks of rework on the critical path | 10 | Reduce: a fire engineer inspects first, in week 11. Owner: the operations manager |
| The builder moves the crew to another site; building works slip | 8 | Transfer: a late-finish penalty in the contract. Owner: the operations manager |
| New staff leave before opening; too few people for the opening weeks | 6 | Reduce: hire one more than needed. Owner: the HR officer |
| The printer is late; a week without posters | 2 | Accept. Owner: the store manager |
Handed to stage 6: five risks with owners and treatments, a review every two weeks, and a three-week buffer held in one place.
Decision point
If a risk has no named owner and no review date, nobody is managing it. Review the register every two weeks and watch for early signs. For the sofas, the sign was the supplier's production photos, due in week 6.
Stage 6 of 6
How do you keep the plan on track, in plain view?
Tool: Gantt Chart · Time: a day to draw, then weekly until the finish
Nobody manages from a network diagram. A Gantt chart shows the schedule as bars against a calendar, which everyone from the owner to the builder can read. Arrows show what waits for what, diamonds mark milestones, shading inside a bar shows work done, and a today line shows where the project stands. The chart displays the critical path; it doesn't find one. That was stage 2.
- Bar: critical path at week 10
- Bar: other work
- Shading: work done
- Slip reported in week 10
- Shared buffer
- Milestone
- Arrow: the next bar waits for this one
- Today
Record what actually happened every week, and let the dates move. Count finished work packages rather than percentages; work reported 90% done tends to stay there. In week 10 the supplier reported the sofas two weeks late. The stock activities became the critical path, and the buffer fell from three weeks to two.
Handed on: a schedule updated every Friday, a slip seen the week it happened, and a showroom open on the center's opening day.
Decision point
If the finish date hasn't moved in months while the work plainly has, the chart has stopped being a schedule. Look for dates someone fixed by hand. Here the slip showed the week it happened, and the supplier flew in 40 sofas for the displays, so the opening held.
Pace
Fast track or thorough
The fast track suits a project of a few weeks, run by one team. The thorough run suits a project of several months, or any date with a penalty attached. The order of the stages stays the same either way.
| Stage | Fast track (a day or two) | Thorough (about two weeks) |
|---|---|---|
| 1. Work Breakdown Structure | A one-page list of deliverables, checked against the 100% rule | Every work package, each with an owner |
| 2. Critical Path Method | Dependencies sketched on a whiteboard | The full network, with float for every activity |
| 3. PERT | Three estimates for the two or three longest activities | Every critical and near-critical activity |
| 4. Resource Allocation Matrix | Ask each person what else is on their plate | A grid of the busy weeks, including work outside the project |
| 5. Risk Management | The top five risks, each with an owner | A scored register, reviewed every two weeks |
| 6. Gantt Chart | Bars on a shared sheet, updated weekly | Scheduling software with arrows, milestones and a baseline |
Failure modes
How project plans go wrong
| What happens | What it looks like | The fix |
|---|---|---|
| Planning from a task list | Work nobody listed turns up halfway through | Build the WBS and test it with the 100% rule |
| One estimate treated as a promise | A date with no odds, missed by a little everywhere | Three estimates for each activity on the critical path |
| Padding every activity | Spare time used up wherever it sits | One shared buffer, held by one person |
| Assuming people are free | Two activities need the same person in the same week | Check each person's load in the busy weeks |
| A chart that never moves | The finish date holds while the work slips | Record actual progress weekly and let dates move |
After the playbook
Measuring the finish
Compare the actual finish with the date, and each activity's actual duration with its three estimates. In the example, the showroom opened on the center's opening day with four days of buffer left.
The gaps show whose estimates run short and which risks came true. Keep the actual durations: they are the best starting estimates for the next project, here the company's third showroom.
Common questions
Project planning: quick answers
How do you plan a project so it finishes on time?
Break the scope into work packages, put them in order to find the critical path, and give the uncertain activities three estimates to get the odds of making the date. Check that nobody is booked twice, list the risks with owners, and keep one shared buffer. Then publish the schedule and update it weekly with actual progress.
What is the critical path in project management?
The longest chain of dependent activities from start to finish. The project can't finish sooner, so a delay on it delays the finish. Activities off the critical path have float: time they can slip without moving the finish date.
How do you calculate a PERT estimate?
Add the optimistic estimate, four times the most likely and the pessimistic, then divide by six. With 8, 10 and 18 weeks, the expected duration is 11 weeks. The standard deviation is the pessimistic minus the optimistic, divided by six: 1.7 weeks.
What is the difference between a WBS and a task list?
A WBS names what the project produces, broken down until each piece can be estimated and owned, and its pieces must add up to the whole scope. A task list names actions and has no test that it is complete, which is how work gets missed.
How much buffer should a project have?
Enough to cover the uncertainty on the critical path. PERT gives one way to size it: the gap between the most-likely finish and a finish you are confident in, three weeks on a 17-week plan in the example. Hold it as one shared buffer, not as padding on each activity.
What is the difference between a Gantt chart and the critical path method?
The Critical Path Method works out which activities control the finish date. A Gantt chart shows the schedule as bars on a calendar so people can read and track it. Most scheduling software does the first and shows you the second.
What if the deadline can't be met?
If the critical path is still longer than the time available after questioning its dependencies, there are three choices: more people or money on critical activities, less scope, or a later date. Raise it early, because each choice costs more the longer it waits.
Frameworks in this playbook
- Work Breakdown StructureStage 1: What, exactly, is all the work?
- Critical Path MethodStage 2: Which chain of work sets the finish date?
- PERTStage 3: How likely are you to finish by the date?
- Resource Allocation MatrixStage 4: Is anyone booked on two things at once?
- Risk Management FrameworkStage 5: What could knock the plan off course?
- Gantt ChartStage 6: How do you keep the plan on track, in plain view?
- RACI MatrixAlongside: who owns each work package
- Agile Sprint PlanningInstead: when the scope can't be fixed up front