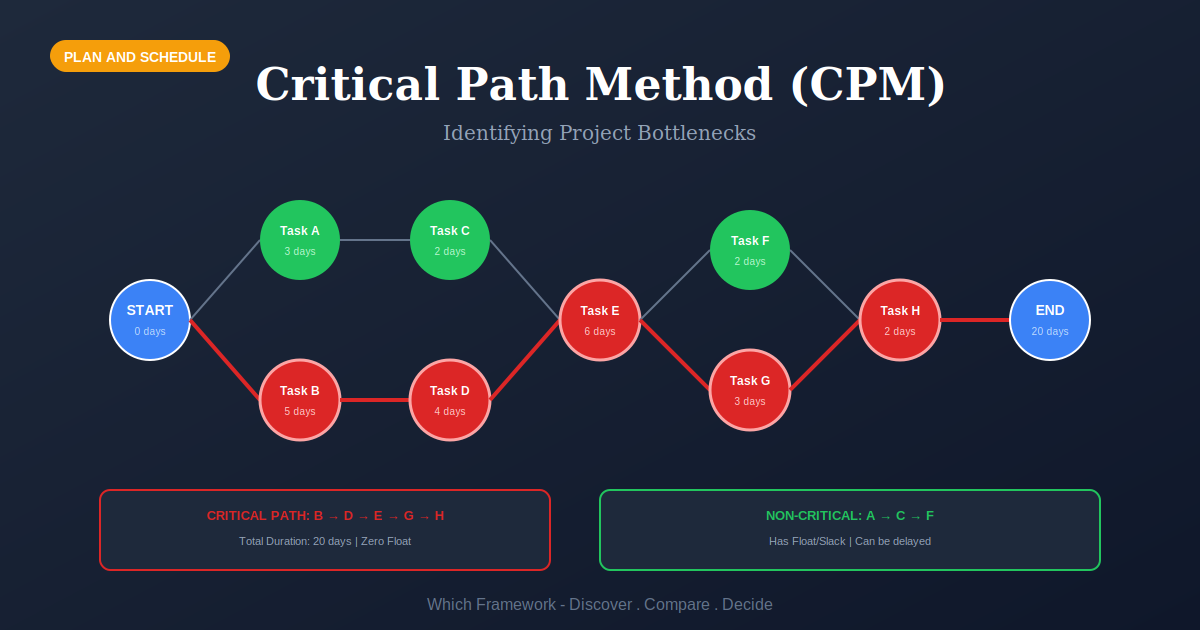
Critical Path Method: The Network Diagram, Explained
Critical Path Method (CPM) is a project scheduling technique that maps activities and dependencies as a network diagram, then calculates the longest path through it to give the shortest possible project duration and each activity’s float.
Before you start
Is CPM your framework?
CPM answers one question: which activities control the finish date, and which ones have room to slip? It needs work that can be broken into discrete activities with known durations and a clear order. Where any of those three is missing, the arithmetic still runs and the answer still looks precise, which is the trap.
It is also a scheduling technique, not a management method. It tells you where the schedule is tight. It does not tell you who does the work, whether the estimates are honest, or what to do when the plan meets reality.
| If your real problem is… | You probably want |
|---|---|
| We need a schedule on a calendar that the team and the client can read | Gantt Chart — bars against dates. The network is where the critical path is calculated; the Gantt is where a schedule is communicated, and most tools show you the second while computing the first Compare CPM and Gantt Chart |
| Our durations are genuinely uncertain, not just unknown to us | PERT — three estimates per activity and a probability for the finish date, rather than one number Compare CPM and PERT |
| We have not yet worked out what all the activities are | Work Breakdown Structure — the decomposition that has to exist before any network can be drawn |
| The constraint is a shared resource, not the sequence of work | Theory of Constraints — CPM assumes people and equipment are available when the network says so |
| Scope changes faster than a schedule can be maintained | Kanban or Sprint Planning — flow and short horizons instead of a long dependency chain |
| Nobody is clear who decides and who does the work | RACI Matrix — responsibility, which a network diagram says nothing about |
| We need to know which activities control the finish date and where the slack is | Critical Path Method — you are in the right place |
What Is It?
A project is a set of activities, some of which cannot start until others finish. Draw those activities as boxes and the dependencies as arrows, and you have a network diagram. Several routes will run from the start of that network to the end, each taking a different total time.
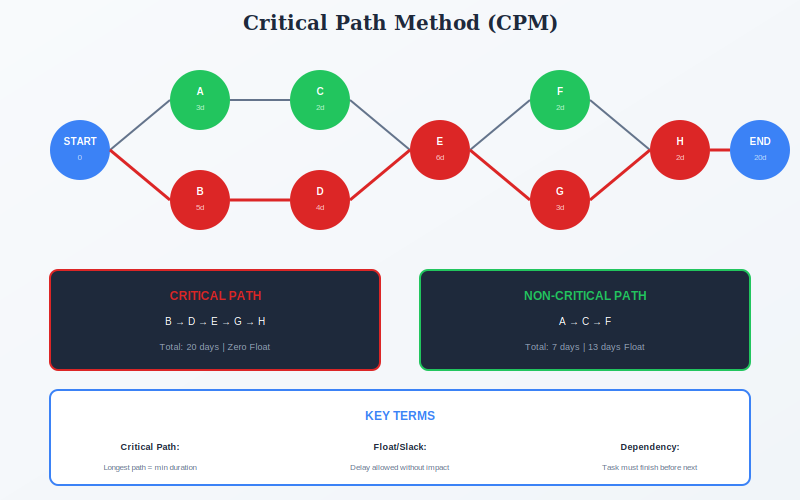
The critical path is the longest of those routes. That sounds like a strange thing to care about until you see why: the project cannot finish before its longest chain of dependent work is done, so the longest path through the network is the shortest possible duration of the project. Everything else can happen alongside it.
Activities that are not on the critical path have float, also called slack: the number of days they can slip without moving the finish date. Float is what makes the method useful in practice. It tells a manager which delays matter and which do not, and where people can be moved from without cost.
The method was developed at DuPont in the late 1950s and presented in 1959. It assumes each activity has one known duration, which is what separates it from PERT, built at the same time for work where durations are genuinely uncertain. CPM depends on a complete activity list, which normally comes from a Work Breakdown Structure, and its output is usually shown to people as a Gantt Chart.
Quick Reference
The calculation
Finding the critical path
The critical path is not found by looking at the diagram. It falls out of two sweeps through the network, and the table below is the network in the diagram above, worked in full.
The forward pass runs left to right and gives each activity its earliest start, which is the latest finish among everything it depends on. Add the duration and you have the earliest finish. The largest earliest finish in the network is the project duration.
The backward pass runs right to left from that duration and gives each activity its latest finish, which is the earliest start among everything that depends on it. Subtract the duration and you have the latest start.
Float is latest start minus earliest start. Activities with zero float form the critical path.
| Activity | Depends on | Duration | ES | EF | LS | LF | Float |
|---|---|---|---|---|---|---|---|
| A | — | 3 | 0 | 3 | 4 | 7 | 4 |
| B | — | 5 | 0 | 5 | 0 | 5 | 0 |
| C | A | 2 | 3 | 5 | 7 | 9 | 4 |
| D | B | 4 | 5 | 9 | 5 | 9 | 0 |
| E | C, D | 6 | 9 | 15 | 9 | 15 | 0 |
| F | E | 2 | 15 | 17 | 16 | 18 | 1 |
| G | E | 3 | 15 | 18 | 15 | 18 | 0 |
| H | F, G | 2 | 18 | 20 | 18 | 20 | 0 |
Where the two joins do the work
Activity E is the row worth studying. It depends on both C and D, which finish at 5 and 9. E cannot start until the later of the two, so its earliest start is 9, and the four days C finished early are simply lost. That is where C's float comes from, and it is the whole mechanism of the forward pass in one row.
H does the same thing in reverse. F and G both feed it, and G is the longer, so G lands on the critical path while F picks up one day of float. Note how little that float is: an activity can be off the critical path and still have almost no room, which is why float is worth reading as a number rather than as a yes-or-no.
Core Features
- Network diagram: activities and the dependencies between them
- Single duration estimate: one number per activity, no probability
- Forward pass: earliest start and finish for every activity
- Backward pass: latest start and finish without moving the end date
- Float: the slack on each activity, and where the schedule can absorb delay
- The critical path: the zero-float chain that sets the project duration
Worked example
A water treatment upgrade, and the path that moved
An illustrative composite. A municipal water treatment plant upgrade in Saskatchewan, Canada, budgeted at CAD 18 million over fourteen months, with a hard finish before spring melt. The network held 240 activities. The critical path ran through the membrane filtration package: procurement, delivery, installation, commissioning.
| Step | What it produced |
|---|---|
| The problem | The first full network came out at 15 months against a 14-month window. One month had to be found somewhere in the critical path. |
| The crash | They shortened the critical path by 11 working days: air freight for two membrane skids, a second commissioning crew, and weekend electrical work. Cost, about CAD 340,000. |
| The result | The finish date moved by 4 days, not 11. A parallel chain through the electrical substation and SCADA integration had carried 7 days of float. Once the membrane path shortened past it, that chain became the new critical path. |
| The second pass | They rebuilt the network and looked at both chains together. Reaching 14 months meant shortening whichever path was longest at each step, which took a further CAD 210,000 spread across two more chains. |
| What actually saved it | A dependency review found that four activities had been sequenced out of habit rather than necessity. Resequencing those took 9 days off the network at no cost, more than the air freight bought. |
Crashing the critical path moves the critical path
Float is a fact about the network as it stands, not a permanent property of an activity. Shorten the longest chain and a different chain becomes longest, so the return on each day of crashing falls away and then stops entirely. The team spent CAD 340,000 for four days because they treated the critical path as fixed and bought time on it past the point where it was still critical.
The other lesson is cheaper. Most schedules contain dependencies that are conventions rather than constraints — sequences inherited from how the last project ran. Questioning the arrows costs nothing and, here, bought more than the air freight did. The arrows deserve as much scrutiny as the durations, and usually get far less.
When to Use
- The work divides into discrete activities with a clear order
- Durations are reasonably well known from experience or standards
- The finish date matters and you need to know what controls it
- Construction, engineering, plant maintenance, shutdowns, migrations, events
- You need to decide where to spend money to pull a date forward
- Delay claims or contractual schedules need a defensible basis
When NOT to Use
- The scope is still being discovered, so the activity list keeps changing
- Durations are guesses dressed as estimates, which the arithmetic will hide
- The real constraint is a shared resource rather than the sequence
- The project is small enough that a list and a calendar would do
- Work arrives continuously rather than as a project with an end
In practice
How CPM goes wrong
The arithmetic is not where projects come unstuck. The inputs and the interpretation are.
| Failure mode | What it looks like | What to do instead |
|---|---|---|
| Treating the critical path as fixed | Money spent shortening one chain long after a parallel chain became the longer one | Recalculate after every change. The path moves; a schedule is a live model, not a picture. |
| Dependencies by habit | Arrows inherited from the last project, encoding convention rather than necessity | For each arrow, ask what physically prevents the two activities running together. |
| Padded durations | Every estimate quietly carries its own buffer, so float exists but is invisible and unusable | Ask for honest durations and hold contingency openly at project level. |
| Ignoring near-critical chains | Attention on the zero-float path while a chain with two days of float slips by four | Watch everything under about 10% of project duration in float, not just zero. |
| Assuming resources are free | Two parallel activities scheduled at once that need the same crane, crew or specialist | Level resources after computing the network, then recompute. CPM does not do this for you. |
| Built once, never updated | A network drawn at kickoff, printed, and never recalculated as actual dates arrive | Update actuals at a fixed cadence. An unmaintained network is worse than none, because it is believed. |
Sourced
Evidence, and how to cite it
CPM came from DuPont and Remington Rand, and was published in 1959.
The work began at DuPont in late 1956, driven by the practical problem of scheduling plant engineering and construction. Morgan Walker of DuPont and James Kelley of Remington Rand Univac presented Critical-Path Planning and Scheduling at the Eastern Joint Computer Conference in December 1959. The two men, with John Sayer, wrote their own account of the development thirty years later.
Kelley, J.E. & Walker, M.R. (1959) ‘Critical-path planning and scheduling’, Proceedings of the Eastern Joint Computer Conference, pp. 160–173; Kelley, J.E., Walker, M.R. & Sayer, J.S. (1989) ‘The origins of CPM: a personal history’, PM Network, 3(2).
The part DuPont actually wanted was removed before publication.
The original aim was not simply to find the longest path. It was the time-cost trade-off: what it costs to shorten a schedule, solved as a linear program so the least-cost schedule for any target date could be found. On the computers of the late 1950s each iteration was slow and the number of activities was tightly limited. Kelley and Walker stripped the trade-off out and published the simplified remainder, which is the method now taught. Crashing survives in practice as a manual exercise rather than as the optimization it began as.
Kelley, Walker & Sayer (1989), PM Network, 3(2); Project Management Institute, Early Literature of Modern Project Management.
The term “critical path” came from PERT, not from CPM.
CPM and PERT were built independently and almost simultaneously, PERT by the US Navy Special Projects Office with Booz Allen Hamilton for the Polaris program. Kelley credited the phrase itself to the PERT developers. The two methods differ in what they assume: CPM takes one duration per activity, PERT takes three and produces a distribution. The original CPM also drew activities as arrows, with the junctions between them called events, which is why older textbook diagrams look unlike the boxes modern tools draw.
Kelley & Walker (1959); Malcolm, D.G., Roseboom, J.H., Clark, C.E. & Fazar, W. (1959) ‘Application of a technique for research and development program evaluation’, Operations Research, 7, pp. 646–669.
How to cite it.
Harvard: Kelley, J.E. and Walker, M.R. (1959) ‘Critical-path planning and scheduling’, Proceedings of the Eastern Joint Computer Conference, pp. 160–173.
APA: Kelley, J. E., & Walker, M. R. (1959). Critical-path planning and scheduling. Proceedings of the Eastern Joint Computer Conference, 160–173.
For the developers’ own history, cite Kelley, Walker and Sayer (1989). For PERT, cite Malcolm et al. (1959).
Key Strengths
- Names what controls the date: turns a vague schedule into a specific chain
- Quantifies slack: float says exactly which delays cost nothing
- Supports trade-offs: shows where spending money would actually pull a date in
- Defensible: a computed network stands up in contract and claim disputes
- Scales: the same arithmetic works on eight activities or eight thousand
Key Weaknesses
- Only as good as its estimates: precise output from approximate input
- Ignores resources: assumes people and equipment are free when needed
- Single durations: no view of risk, which is what PERT was built for
- Maintenance cost: a large network needs constant updating to stay true
- Encourages false confidence: a computed date reads as a promised one
Sequencing
What to run before and after
CPM sits between defining the work and running it. It cannot start without an activity list and it does not survive contact with delivery unless something maintains it.
Before
Get the activity list and the dependencies
A network is only as complete as the decomposition behind it. Missing activities do not show up as errors; they show up as a project that finishes late for reasons the schedule never mentioned.
During
Add uncertainty and resource reality
The network assumes one duration per activity and unlimited resources. Neither holds. Add a risk view where durations are uncertain, and level resources before treating any date as committed.
After
Communicate it, then keep recalculating
Nobody manages from a network diagram. Publish the schedule as a Gantt, record actual dates on a fixed cadence, and recompute, because the critical path moves as soon as anything changes.
Common questions
Critical path method: quick answers
What is the critical path in a project network diagram?
It is the longest path of dependent activities from start to finish, and therefore the shortest time the project can possibly take. Every activity on it has zero float, so delaying any one of them delays the whole project by the same amount. A network can have more than one critical path.
How do you calculate the critical path step by step?
Four steps. List the activities with their durations and what each one depends on. Run a forward pass from the start, taking the latest finish of the predecessors as each activity's earliest start. Run a backward pass from the project end to get each activity's latest start. Float is latest start minus earliest start; the activities with zero float form the critical path.
What is float, and how is it different from slack?
They are the same thing, and the terms are interchangeable. Float is the number of days an activity can slip without moving the project end date. Total float measures slippage against the project end; free float measures slippage before the next activity is affected, which is always the smaller of the two.
What is the difference between a critical path diagram and a Gantt chart?
A network diagram shows dependencies: which activity must finish before another can start. A Gantt chart shows activities as bars against a calendar. The network is where the critical path is calculated; the Gantt is where the schedule is communicated and tracked. Most scheduling software computes the network behind the scenes and shows you the Gantt.
What is the difference between CPM and PERT?
How each one treats duration. CPM uses a single estimate per activity and suits work whose timings are well known, such as construction and plant maintenance. PERT uses three estimates for each activity, weights them, and produces a probability distribution for the completion date. PERT was built for research and development work where durations are genuinely uncertain.
Why do some critical path diagrams use boxes and others use arrows?
Because there are two notations. The original 1959 method drew each activity as an arrow, with the junctions between arrows as events, which is called activity-on-arrow. Modern practice and the PMBOK Guide draw each activity as a box and use arrows only for dependencies, which is called activity-on-node. Both produce the same critical path from the same data.
Who created the critical path method?
Morgan R. Walker of DuPont and James E. Kelley Jr. of Remington Rand Univac, from work beginning in late 1956. They presented it in Critical-Path Planning and Scheduling at the Eastern Joint Computer Conference in December 1959. Kelley credited the term critical path itself to the team developing PERT for the US Navy at around the same time.
How do I cite the critical path method?
Harvard style: Kelley, J.E. and Walker, M.R. (1959) 'Critical-path planning and scheduling', Proceedings of the Eastern Joint Computer Conference, pp. 160-173. APA style: Kelley, J. E., & Walker, M. R. (1959). Critical-path planning and scheduling. Proceedings of the Eastern Joint Computer Conference, 160-173. For the developers' own account, cite Kelley, Walker and Sayer (1989) in PM Network.
Deep Resources
Frameworks related to Critical Path Method
- PERTThree-point estimation producing a probability distribution for the completion date…
- Gantt ChartActivities as bars against a calendar, the usual way a computed schedule is published…
- Work Breakdown Structure (WBS)Decomposition of scope into the deliverables and activities a network is built from…