Playbook
How to Increase Market Share
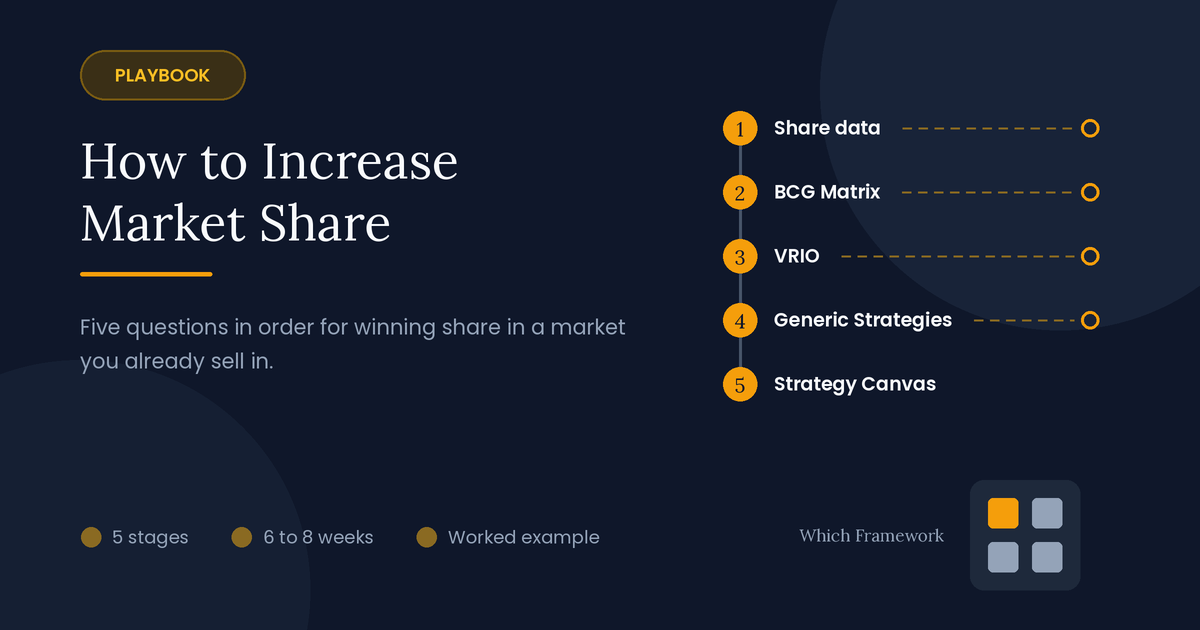
Five questions, asked in order, for winning share in a market you already sell in.
A market share playbook is a five-stage sequence of strategy tools that finds where share is being lost and worth winning back, then chooses how to win it from advantages rivals can't copy.
The route
Five questions, in order
For a bigger share of a market you already sell in. For a new country or kind of customer, see How to Expand into a New Market.
The first two stages find where share is worth winning; the last three decide how to win it. Four points can stop you or send you elsewhere.
On timing: six to eight weeks in all. The stage 1 interviews also gather what stage 5 needs, so run them once.
Free tools run each stage on your own numbers. The Market Share Growth Tool lays out all five stages and starts you off; or start at stage 1 with the Market Share Calculator, or take the 12-minute guided tour first.
-
Where are you losing share, and to whom?Stage 1 · No framework: your own sales and market data
Passes on: share by line over three years, and why buyers left
Sales falling, share steady?The market is shrinking; more share won't fix it.
-
Which product lines are worth fighting for?Stage 2 · BCG Growth-Share Matrix
Passes on: the line to push, and the line that pays for it
Two lines worth pushing?Fund one fully. Half-funding both wins neither.
-
What do you have that rivals can't copy?Stage 3 · VRIO
Passes on: the advantages that hold up
Nothing passes?Then only price is left; see stage 4.
-
On what basis can you win?Stage 4 · Porter's Generic Strategies
Passes on: one basis of competition, and its segment
Not the lowest-cost player?Don't cut prices to win share.
-
What exactly will you change?Stage 5 · Blue Ocean Strategy
Passes on: what to drop, cut, raise and add
- Is the share coming back?Then · Track share quarterly, and watch how rivals respond
The example
One company, followed all the way through
This playbook follows one company from start to finish. It is an illustrative composite, and the details are simplified.
A paint maker in Colombo, Sri Lanka, sells about LKR 6.2 billion a year across four product lines. It sells through about 1,400 dealers, the paint shops, to two kinds of buyers: homeowners, and the painting contractors they hire. It is the third-largest brand. An international brand leads the market, and a low-price local brand is growing fast.
Its share of the market has slipped for three years. The sales director's answer is a 10% price cut on its main lines.
Each stage below ends with what the company produced at that step, so you can watch one stage's output become the next stage's input.
Stage 1 of 5
Where are you losing share, and to whom?
No framework: your own sales and market data · Time: 2 to 3 weeks
Start with your own figures. No framework can tell you where you are losing share; your sales records and the market's size can. Market share is your sales divided by everyone's sales in the same market and period.
Market share, worked for one product line
Market shareYour sales ÷ total sales in the market
- Exterior paint, last yearLKR 1.32 billion ÷ LKR 12 billion = 11%
- Three years earlier15%, so four points lost while the market grew 12% a year
- Where the market figure came fromThe paint manufacturers' association, checked against import data for pigments and resins
Work it out for each product line and region, for the last three years. Use value (money) when brands sell at very different prices, and volume (liters, units) when they don't, and say which one you used.
Then ask why. Talk to 15 to 20 people who chose a rival over you, or who sell both: here, dealers and painting contractors. Ask what made them choose, and which things they weigh when they compare brands. Keep that list; stage 5 needs it.
| Product line | Share 3 years ago | Share now | Lost mainly to | What buyers said |
|---|---|---|---|---|
| Interior paint | 17% | 15% | The low-price brand | Cheaper by about a quarter |
| Exterior paint | 15% | 11% | The market leader | Any color mixed in the shop; a 7-year warranty |
| Wood finishes | 30% | 31% | – | The brand carpenters trust |
| Waterproofing | 8% | 9% | – | Few know the company makes it |
Handed to stage 2: share by line, and the rival behind each loss. Exterior paint lost the most, to the market leader, in a market growing fast.
Decision point
If sales are falling but share is steady, the market is shrinking. Winning share won't fix that; look for new markets instead, with the market expansion playbook. Here, share fell while the market grew, so the route went on.
Stage 2 of 5
Which product lines are worth fighting for?
Tool: BCG Growth-Share Matrix · Time: 2 to 3 days
Share is worth more in some lines than others. The BCG Growth-Share Matrix places each product line by two measures: how fast its market is growing, and its relative market share, which is your share divided by the largest rival's. It is a ratio, not a percentage: above 1.0 you lead, below it you don't.
Relative market share, worked for two lines
Relative market shareYour share ÷ the largest rival's share
- Exterior paint11% ÷ 36% = 0.31. Well behind the leader
- Wood finishes31% ÷ 19% = 1.63. The company leads, so divide by the next largest
| Product line | Market growth | Your share | Largest rival's share | Relative share | Quadrant |
|---|---|---|---|---|---|
| Interior paint | 3% | 15% | 38% | 0.39 | Dog |
| Exterior paint | 12% | 11% | 36% | 0.31 | Question Mark |
| Wood finishes | 4% | 31% | 19% | 1.63 | Cash Cow |
| Waterproofing | 14% | 9% | 28% | 0.32 | Question Mark |
Each line lands in one of four quadrants, and each quadrant says something different about where money should go. Share is usually worth fighting for in a Question Mark: a fast-growing market where you are behind. But half-funding two of them is the expensive middle, so pick one.
Handed to stage 3: exterior paint, a fast-growing market where the company is far behind, funded by wood finishes. Waterproofing waits a year.
Decision point
Before trusting the quadrants, test the assumption the whole matrix rests on: that more share brings lower costs or better prices. If it doesn't in your industry, don't chase share for its own sake. In paint it largely does: a color-mixing machine or a delivery route costs about the same however much paint goes through it, so more liters per shop means a lower cost per liter.
Stage 3 of 5
What do you have that rivals can't easily copy?
Tool: VRIO · Time: about a week
Before choosing how to compete, find out what you can hold. VRIO tests each resource or capability with four questions, in order. Only one that passes all four is a lasting advantage.
What the four VRIO letters stand for
- VValue
- Does it help you respond to a threat or an opportunity?
- RRarity
- Do few competitors have it?
- IImitability
- Is it costly for others to obtain or develop?
- OOrganization
- Is the company organized to capture value from it?
VRIO can't judge value on its own. Value is set by buyers and rivals, so take it from the stage 1 interviews, not from what the company is proud of. Expect most resources to stop at rarity. One or two that pass is a good result.
| Resource | V | R | I | O | Verdict |
|---|---|---|---|---|---|
| Factory with 30% spare capacity | Yes | No | – | – | Parity: every serious rival has one |
| 1,400 dealers | Yes | No | – | – | Parity, or worse: the leader has 2,600 |
| A painters' club of 3,000 contractors | Yes | Yes | No | – | Temporary: the leader could start one within a year |
| Ten years of coastal weather tests | Yes | Yes | Yes | No | Unexploited: hard to copy, and nobody uses it |
Each question is asked only if the one before it was answered yes.
Look hardest at a resource that passes the first three tests but not the fourth. Here, the company had run paint panels at a seaside test site near Galle for ten years. Its exterior paint lasts longer in salt air and monsoon rain than the leader's. No rival can buy ten years of results, but no buyer had ever been told about them.
Handed to stage 4: one advantage rivals can't copy, the coastal test results, and a temporary one, the painters' club.
Decision point
If nothing passes rarity, you have only price to fight with. Stage 4 tells you whether you can afford that. Usually only the lowest-cost player can.
Stage 4 of 5
On what basis can you win share: lower cost, or something different?
Tool: Porter's Generic Strategies · Time: one workshop, half a day
Porter's Generic Strategies say there are two ways to win in a market you are already in: produce at lower cost than rivals, or offer something buyers value enough to pay more for. Crossed with how much of the market you serve, that gives four positions.
Choose the one you can hold, using stage 3. Porter's warning is about the firm that tries to be cheap and different at once and ends up stuck in the middle: it can't win price-sensitive buyers from the cost leader, and can't charge a premium to buyers who want something particular.
That described the paint maker exactly. It was priced between the two rivals and known for nothing in particular, so it lost interior buyers to the cheaper brand and exterior buyers to the leader at the same time.
Handed to stage 5: a focused position: exterior paint for coastal and high-rain homes, built on the test results and sold through contractors.
Decision point
If you are not the lowest-cost player, don't cut prices to win share. The rival with lower costs can match any cut and still make money, for longer than you can. The sales director's 10% price cut was dropped here: the leader could have matched it within a month.
Stage 5 of 5
What exactly will you change in what you offer?
Tool: Blue Ocean Strategy · Time: 2 to 3 weeks
Blue Ocean Strategy is built to escape a crowded market, not fight in it, but its two tools work here too. The first is the strategy canvas: the factors buyers weigh, from stage 1, with each player scored on how much of each it offers. Joined up, each player's scores make its value curve.
- Market leader
- Low-price brand
- The company today
- The company's new offer
The second is the four actions, applied to those factors. Two cut cost and two lift value. Choose them to serve the stage 4 position, and pay for what you raise with what you cut.
The four actions, often called the ERRC grid
- EEliminate
- Which factors the industry takes for granted can go?
- RReduce
- Which are over-served, to match rivals?
- RRaise
- Which should rise well above the industry standard?
- CCreate
- What has the industry never offered?
| Action | Factor | The change | Effect |
|---|---|---|---|
| Eliminate | TV advertising | Stopped | Lowers cost |
| Reduce | Color range | 1,200 shades to the 300 that sell | Lowers cost |
| Raise | Proven life, warranty | Results published; warranty 3 to 10 years | Lifts value |
| Raise | Colors mixed in the shop | Machines in 200 coastal dealers | Lifts value |
| Raise | Help for painters | Training and certification | Lifts value |
| Create | Site check before work | A free damp check before each quote; no brand offers one | Lifts value |
The new curve should cross the leader's: below it where buyers care less, above it where they care most.
Handed on: a plan for exterior paint in coastal districts, paid for largely by the advertising and color range it cuts.
Decision point
If your new curve sits above the leader's on every factor, it isn't a strategy. It is the same strategy with a bigger budget, and the larger rival can outspend you. Keep cutting until the curves cross.
Pace
Fast track or thorough
The fast track suits a small business with a few product lines and rivals it knows well. The thorough run suits a crowded market, where a wrong reading of why buyers switch costs a year. The order of the stages stays the same either way.
| Stage | Fast track (about two weeks) | Thorough (6 to 8 weeks) |
|---|---|---|
| 1. Share data | Your sales against a published market estimate | Share by line and region, three years, with 15 to 20 interviews |
| 2. BCG Matrix | Growth and share by eye | Measured growth, and the share assumption tested |
| 3. VRIO | The leadership team, in an afternoon | Each claim checked against buyer evidence |
| 4. Generic Strategies | One meeting | Costs compared with rivals before choosing |
| 5. Strategy canvas | Scores from the team | Scores from buyers, and a costed four-action plan |
Failure modes
How efforts to win market share go wrong
| What happens | What it looks like | The fix |
|---|---|---|
| Cutting price first | A price war against a rival with lower costs | Check who leads on cost in stage 4 |
| Chasing share everywhere | Every line pushed at once, none of them far enough | Choose one line in stage 2 |
| Confusing a shrinking market with lost share | Fighting for share of something smaller each year | Check market size in stage 1 |
| Being stuck in the middle | A bit cheaper and a bit better, and chosen by nobody | Pick one basis in stage 4 |
| Adding without cutting | A new curve above the leader's everywhere, and costs to match | Use all four actions in stage 5 |
After the playbook
Tracking share, and watching rivals
Share figures arrive slowly, often once a quarter, so track the early signs every month as KPIs: here, coastal dealers with a mixing machine, contractors certified, and warranties registered. Turn the plan's main steps into OKRs for the teams that carry them out.
Expect the rivals to respond. The leader may lengthen its own warranty within months; a warranty is easy to copy. What it can't copy quickly is the ten years of test results behind it, which is why stage 3 came before the choice. In the example, exterior share rose from 11% to 14% over the next 18 months, most of it in coastal districts.
Run the stage 2 check once a year. When the pushed line leads its market, the next Question Mark gets the money.
Common questions
Market share: quick answers
How do you increase market share?
Find where you are losing share and to whom, choose the product line where share is worth winning, test what you have that rivals can't copy, pick one basis of competition, then change what you offer to match it. Cutting prices only works if you have the lowest costs in the market.
How do you calculate market share?
Divide your sales by the total sales in the same market over the same period. LKR 1.32 billion of sales in a LKR 12 billion market is an 11% share. Use value when brands sell at very different prices and volume when they don't, and say which one you used.
What is relative market share?
Your market share divided by the largest rival's share. It is a ratio, not a percentage: 11% against a leader's 36% is 0.31. Above 1.0 you lead the market. The BCG Growth-Share Matrix uses it for its horizontal axis.
Should you cut prices to gain market share?
Only if you have the lowest costs in the market. A rival with lower costs can match any price cut and still make money, for longer than you can. Otherwise, a price cut lowers your margins without winning lasting share.
What is the difference between market share and market growth?
Market growth is how fast the whole market gets bigger. Market share is how much of it you hold. Your sales can rise while your share falls, if the market grows faster than you do, and your share can hold while sales fall, if the market shrinks.
What does stuck in the middle mean?
Porter's term for a business that tries to be both the cheapest and the most distinctive, and ends up neither. It can't win price-sensitive buyers from the cost leader, and can't charge a premium to buyers who want something particular.
Don't Porter and Blue Ocean Strategy contradict each other?
On one point, yes. Porter says a business chasing low cost and uniqueness at once ends up with neither; Blue Ocean says that trade-off goes away when you change which factors you compete on. This playbook chooses one position with Porter first, then uses Blue Ocean's canvas and four actions to fund it, cutting what the chosen buyers don't value.
How long does it take to gain market share?
The analysis takes six to eight weeks. The share itself usually moves over one to two years, because buyers switch gradually and market figures arrive quarterly. Track early signs monthly, such as dealers won or trials started, rather than waiting for share figures.
Frameworks in this playbook
- BCG Growth-Share MatrixStage 2: Which product lines are worth fighting for?
- VRIOStage 3: What do you have that rivals can't easily copy?
- Porter's Generic StrategiesStage 4: On what basis can you win share: lower cost, or something different?
- Blue Ocean StrategyStage 5: What exactly will you change in what you offer?
- Resource-Based ViewBackground: the theory behind VRIO, on why some advantages can't be bought
- KPIsAfter: the early signs tracked monthly
- OKRAfter: the plan's steps, given to the teams that carry them out