Playbook
How to Decide on a Major Investment
Six questions, asked in order, before money that is hard to get back is spent.
An investment decision playbook is a six-stage sequence that compares options, checks they pay and can be funded, tests them against several futures, and limits the risk before anyone commits.
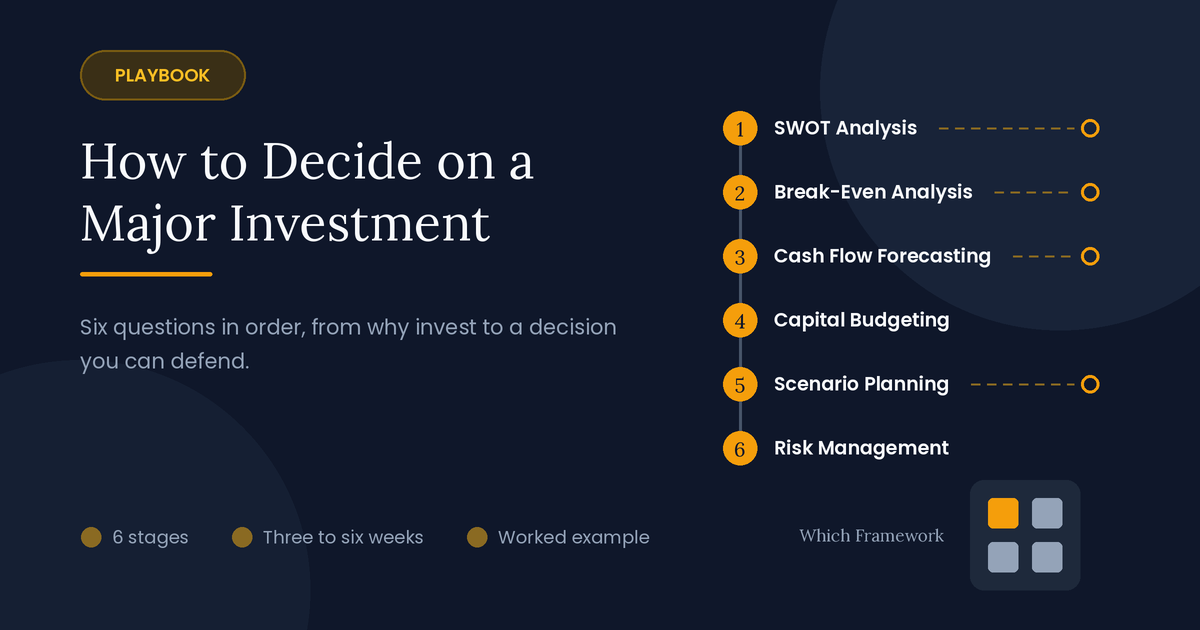
The route
Six questions, in order
The route runs from why to whether: why invest and in what, how much it must sell, whether the business can afford it, whether it adds value, how it fares if the future differs, and what to watch once the money is spent.
On timing: all six stages come before the decision, about three to six weeks for a large investment. Stage 6 also runs after it, until the investment is working.
-
Why invest, and in what?Stage 1 · SWOT Analysis
Passes on: the case for investing, and two or three real options
Only one option on the table?Add the smallest one, and doing nothing.
-
How much must it sell?Stage 2 · Break-Even Analysis
Passes on: the volume needed, and whether anyone believes it
Nobody believes the volume?Stop here.
-
Can we afford it?Stage 3 · Cash Flow Forecasting
Passes on: the cash flows each year, and the lowest point
Cash runs out at the low point?Fix the funding before going on.
-
Does it add value?Stage 4 · Capital Budgeting
Passes on: net present value, rate of return and payback for each option
-
What if the future differs?Stage 5 · Scenario Planning
Passes on: the result in four futures, and the moves that protect it
Loses badly in one future?Change the deal, not the forecast.
-
What could still go wrong?Stage 6 · Risk Management Framework
Passes on: risks with owners, inside a limit set in advance
- Did it pay off?Then · Review it against the forecast
The example
One company, followed all the way through
This playbook follows one company from start to finish. It is an illustrative composite, and the figures are simplified and before tax.
A family-owned food maker in Wroclaw, Poland, makes frozen pierogi (filled dumplings). Its customers are three Polish supermarket chains, and its one production line runs at 92% of capacity. A German supermarket chain now wants a supplier for 300 stores: about 1,100 tonnes a year, more than the company makes today.
Saying yes means a new production line costing PLN 14 million (Polish zloty), about three years of the company's profit. The owners have to decide within two months.
Each stage below ends with what the company produced at that step, so you can watch one stage's output become the next stage's input.
Stage 1 of 6
Why invest at all, and what are the options?
Tool: SWOT Analysis · Time: 1 to 2 days
A large investment should come out of strategy, not arrive as a wish. A SWOT analysis sorts what you know into four boxes: Strengths and Weaknesses inside the company, Opportunities and Threats outside it. Note the evidence for each line, or it reads as confident and means little.
A filled grid is still four lists. The strategy comes from pairing across boxes: a strength that meets an opportunity, or a weakness that blocks one. Here, the certificate and recipes meet the German order, and the full line blocks it. Every way of removing that block is an option.
| Option | What it means | Capital |
|---|---|---|
| A. New line | A second production line in an empty hall on site | PLN 14 million, plus 2 million in stock and unpaid invoices |
| B. Second shift and a co-packer | Run the old line at night; pay another maker for the rest | PLN 1.5 million, plus 2 million in stock and unpaid invoices |
| C. Decline | Stay with the Polish chains | None |
Handed to stage 2: a case for growing through the German order, and three options to cost, from a new line to declining.
Decision point
If only one option is on the table, add the smallest one that could work, and doing nothing. An option judged alone always looks good. Here, nobody had costed the second shift until the pairing named it.
Stage 2 of 6
How much must it sell to cover its costs?
Tool: Break-Even Analysis · Time: half a day, plus a call to the buyer
Before forecasting years of cash, check the volume the investment needs. Each kilogram sold leaves a contribution margin: the price minus the costs that rise with volume. Fixed costs divided by that margin gives the volume at which the investment stops losing money.
Option A, worked
Break-even volumeFixed costs ÷ contribution margin per kilogram
- Contribution marginPrice PLN 14.00 a kilogram, minus variable costs of 8.50 (meat, flour, packing, freight) = 5.50
- Fixed costs a yearLine staff 1.6 million, maintenance and energy 0.5 million, and the line itself spread over 10 years, 1.4 million: 3.5 million
- Break-even3.5 million ÷ 5.50 = about 640 tonnes a year
Report the margin of safety with it: how far expected sales sit above break-even. Then put the number in front of someone who knows the market and ask whether it is plausible. That judgment is the real output.
Interest on the bank loan is left out here, because stage 4 charges for money through its discount rate. A lender would add it, about PLN 0.6 million a year, which puts break-even near 750 tonnes, above year 1's 700.
| Year | Expected tonnes | Margin of safety |
|---|---|---|
| 1, while 300 stores are added | 700 | 9% |
| 2 | 950 | 33% |
| 3 onward | 1,100 | 42% |
Handed to stage 3: a break-even of about 640 tonnes, a thin first year, and the German buyer's sales data backing 1,100 tonnes from year 3.
Decision point
If nobody with market knowledge believes the volume, stop. The rest of the route would only decorate a number nobody trusts. Here, the buyer's sales of similar products in 40 test stores supported 1,100 tonnes.
Stage 3 of 6
Can the business afford it, month by month?
Tool: Cash Flow Forecasting · Time: 2 to 3 days
Two forecasts, for two different questions. A yearly forecast of the investment's own cash, built from projected profit adjusted for timing (the indirect method), feeds stage 4. A quarter-by-quarter forecast of the whole company's cash answers whether it can afford the investment at all.
Value and affordability are different tests, and an investment has to pass both. Find the trough, the lowest point cash reaches, and the date it lands. Then rerun the forecast with the biggest receipt late.
| Quarter | Without | With the line | What happens |
|---|---|---|---|
| 1 | 5.5 | 1.5 | Deposit on the new line, 4.0 |
| 2 | 6.0 | 5.0 | Bank loan of 9.0 arrives; second payment for the new line, 6.0 |
| 3 | 6.5 | 0.5 | Final payment for the new line, 4.0; ingredients and packaging bought ahead, 1.0 |
| 4 | 7.0 | −0.8 | First deliveries. Out: ingredients, packing and freight 1.5, line staff and running costs 0.5, loan repayment and interest 0.6. In: only 0.8, because the German chain pays 60 days after delivery |
| 5 | 7.5 | −0.5 | A full quarter of the chain's payments, 2.4, against the same 2.6 going out |
| 6 | 8.0 | −0.2 | The same again; cash is above zero from quarter 7 |
Handed to stage 4: yearly cash flows for options A and B, and a trough of PLN 0.8 million below zero in quarter 4, beyond the overdraft, closed before going further.
Decision point
If cash runs out at the trough, fix the funding before going on. A valuable investment the business cannot carry through its lowest quarter is not affordable. Here, the bank raised the overdraft to PLN 2 million, and the line's maker split the last payment in two.
Stage 4 of 6
Does it add value, and which option adds most?
Tool: Capital Budgeting · Time: 1 to 2 days
Capital budgeting asks whether the investment earns more than the money costs. A zloty next year is worth less than one today, so each year's cash is discounted at the cost of capital: the return lenders and owners expect, 10% here. The sum is the net present value (NPV). Above zero adds value.
Option A, worked
Net present value at 10%Each year's cash flow ÷ 1.10year, added up
- Year 0−16.0 million: the line, 14, and stock and unpaid invoices, 2
- Years 1 and 21.75 in year 1 (700 tonnes), then 3.12 in year 2 (950 tonnes)
- Years 3 to 93.95 a year (1,100 tonnes)
- Year 106.95: the year's 3.95, plus the 2 million tied up in stock and unpaid invoices, released as the work winds down, plus 1 million from selling the line
- Net present value+6.8 million: value added after a 10% return on the money
Report three more measures, because people decide on them: the internal rate of return (IRR), the discount rate at which NPV would be zero; payback, the years until the money is back; and the capital at stake. When they disagree, NPV wins. A small project can show a higher rate of return while a large one adds more value.
| Measure | A. New line | B. Second shift and co-packer |
|---|---|---|
| Capital at stake | PLN 16.0 million | PLN 3.5 million |
| Net present value at 10% | +6.8 million | +5.3 million |
| Internal rate of return | 18% | 36% |
| Payback | 4.8 years | 2.7 years |
Handed to stage 5: option A adding PLN 6.8 million against B's 5.3, with B looking better on rate of return and payback, and the reason NPV decides.
Decision point
If NPV and the rate of return point to different options, take the NPV, and say why in the paper. Here, B returns more per zloty but adds less value in total, and it depends on a co-packer the company doesn't control.
Stage 5 of 6
What happens if the future turns out differently?
Tool: Scenario Planning · Time: a 1-day workshop, plus a week to rework the deal
A single NPV hides how much rests on the volume and price assumptions. Scenario planning tests them. List the forces that could shape the result, rank each by impact and by uncertainty, and make the two most uncertain the axes of a 2x2. The axes must vary independently, or two quadrants describe impossible worlds.
Forces that matter but are predictable, such as Polish wages rising, go into every scenario rather than on an axis. Then rerun stage 4 in each quadrant.
Look for moves that hold up in every future. Here, two contract terms protect the Double hit quadrant: a minimum order for five years, and a clause that passes meat price rises on to the chain. Then name signposts, early signs of which future is arriving: the chain's monthly sales of the range, and the meat price index.
Handed to stage 6: a five-year minimum order of 1,000 tonnes and a clause passing meat price rises on, which lifted the worst case from −4.5 million to about −0.6 million.
Decision point
If the investment loses badly in one future, change the deal, not the forecast. Contracts, staging and options can reshape the bad quadrant. The German chain accepted both clauses in exchange for a price fixed for two years.
Stage 6 of 6
What could still go wrong once you commit?
Tool: Risk Management Framework · Time: 2 days before the decision, then monthly
Scenarios covered the futures nobody controls. Risk management covers the events that could still hurt once you commit: each listed with an owner, scored for probability and impact, and given a treatment and a review date.
Start with the risk appetite: how much the business will accept losing. Here the owners set it at PLN 3 million, the reserve they keep. Without one, every risk looks worth treating. A treatment with no owner is a wish, and one with no date is an intention.
| Risk | Treatment | Owner |
|---|---|---|
| Sales in euros, costs in zloty; a stronger zloty cuts the margin | Reduce: fix the exchange rate for half of each year's sales in advance | Finance director |
| The line is installed late and misses the first orders | Transfer: a late-delivery penalty in the maker's contract | Operations manager |
| The German chain's food safety audit finds a fault | Reduce: a practice audit by an outside inspector first | Quality manager |
| The one engineer who knows the new line leaves | Reduce: the maker trains two more | Plant manager |
Handed on: a register of four risks with owners, a limit of PLN 3 million, and a monthly review of the signposts and the register together.
Decision point
If one risk could cost more than the appetite, it changes the decision, not just the register. Here, an unhedged currency swing could have cost more than PLN 3 million, so the owners approved the line only with the exchange rate fixed for half of sales.
Pace
Fast track or thorough
The fast track suits an investment the business could absorb if it failed. The thorough run suits one that would hurt, as in the example. The order of the stages stays the same either way.
| Stage | Fast track (a few days) | Thorough (three to six weeks) |
|---|---|---|
| 1. SWOT Analysis | One page, with the option of doing nothing | Evidence for each line, options from pairing |
| 2. Break-Even Analysis | One product, one price | Each option, checked with someone who knows the market |
| 3. Cash Flow Forecasting | Yearly cash flows only | Yearly flows plus the company's cash by quarter |
| 4. Capital Budgeting | NPV and payback | NPV, IRR and payback for every option |
| 5. Scenario Planning | Best, base and worst case | Four scenarios, signposts and a reworked deal |
| 6. Risk Management | Top five risks with owners | A register within a stated risk appetite |
Failure modes
How investment decisions go wrong
| What happens | What it looks like | The fix |
|---|---|---|
| One option judged alone | A yes or no on the proposal everyone wanted | Cost at least two options and doing nothing |
| A volume nobody checked | A spreadsheet that works at any sales figure typed in | Break-even, shown to someone who knows the market |
| Value without cash | A profitable project that runs out of money in year one | Forecast the company's cash by quarter |
| Deciding on payback alone | Quick wins chosen over bigger value | Let NPV decide; report payback alongside |
| One forecast treated as the future | A precise number resting on two guesses | Rerun it in four scenarios |
After the playbook
Did it pay off?
Set two review dates when you decide: one at 12 months and one at three years. At each, compare actual cash flows with the stage 3 forecast and split any gap into volume, price and cost, using variance analysis.
In the example, the first year's volume came in at 730 tonnes, slightly above forecast, but the margin was lower than planned because of a weaker euro, which the hedge had only half covered.
Common questions
Investment decisions: quick answers
How do you decide whether to make a major investment?
Start from strategy and compare at least two options with doing nothing. Check the volume each needs to break even and whether the business can fund it through its lowest cash point. Then calculate the net present value of each, test it in several futures, and set a limit on the risk you will carry before you commit.
What is net present value?
The sum of an investment's future cash flows, each discounted back to today at the cost of capital, minus what it costs now. Above zero, it earns more than the money costs. Between options, the higher NPV adds more value.
What is the difference between NPV and IRR?
NPV says how much value an investment adds in today's money. IRR is the discount rate at which NPV would be zero, a percentage return. They agree for most single projects, but a small project can show a higher IRR while a larger one adds more value. When they disagree, take the NPV.
What discount rate should I use?
Your cost of capital: the return your lenders and owners expect, weighted by how much each provides. Riskier investments justify a higher rate. Test the result at a rate a few points higher; if the decision flips, say so.
Why isn't a positive NPV enough?
Because value and cash are different tests. An investment can add value over ten years and still run the business out of cash in its first year. A quarterly cash forecast finds that trough before you sign.
How does scenario planning help an investment decision?
It shows how much the result depends on assumptions you can't control. Rerunning the NPV in four futures shows where the investment fails, and often points to contract terms or staging that protect the worst case.
What is a margin of safety in break-even analysis?
How far expected sales sit above the break-even volume, as a percentage of expected sales. At 1,100 tonnes against a 640-tonne break-even, it is 42%: sales could fall that far before the investment loses money.
Frameworks in this playbook
- SWOT AnalysisStage 1: Why invest at all, and what are the options?
- Break-Even AnalysisStage 2: How much must it sell to cover its costs?
- Cash Flow ForecastingStage 3: Can the business afford it, month by month?
- Capital BudgetingStage 4: Does it add value, and which option adds most?
- Scenario PlanningStage 5: What happens if the future turns out differently?
- Risk Management FrameworkStage 6: What could still go wrong once you commit?
- Variance AnalysisAfter: comparing results with the forecast
- PESTEL AnalysisBefore stage 5: a wider sweep of the forces