Cash Flow Forecasting: The 13-Week View, and Which Method Fits Which Horizon
Cash Flow Forecasting is a projection of money entering and leaving a business over a stated horizon, built either from expected receipts and payments or from projected profit adjusted for non-cash items.
Before you start
Is this your framework?
This answers one question: will there be money in the account on the day we need it. Not whether the business is profitable, which is a different question with a different answer. Profitable companies run out of cash regularly.
The output is a dated balance, week by week or month by month. It is a projection, so it will be wrong; the useful version is the one that is wrong in ways you measure and correct. If your question is not about timing, the table below points elsewhere.
| If your real problem is… | You probably want |
|---|---|
| The forecast was wrong and we want to know why | Variance Analysis — splitting the miss into amount, timing and omission. This page builds the forecast; that one explains the gap Compare Cash Flow Forecasting and Variance Analysis |
| What volume do we need before we stop losing money | Break-Even Analysis — a volume threshold with no time in it at all Compare Cash Flow Forecasting and Break-Even Analysis |
| Should we spend capital on this project | Capital Budgeting — discounted returns over years, not liquidity next month |
| The cost base itself needs rebuilding | Zero-Based Budgeting — deciding what to spend, rather than when it leaves the account |
| We need to know which measures the board should see | KPIs — a forecast is an input to reporting, not a reporting framework |
| The uncertainty is structural, not just timing | Scenario Planning — several plausible futures rather than one line with error bars |
| When will the bank balance be lowest, and how low | Cash Flow Forecasting — you are in the right place |
What Is It?
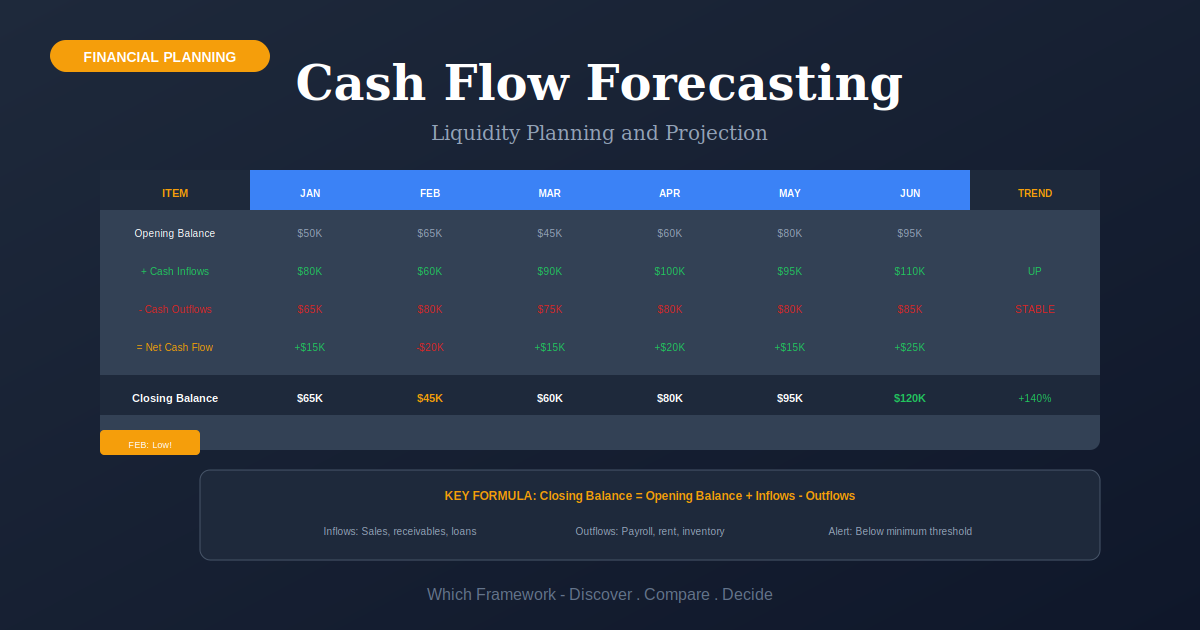
A cash flow forecast is a dated list of money coming in and money going out, run forward to show the balance at each point. The number that matters is not the total. It is the lowest point, and the date it falls on.
This is not the profit forecast with different formatting. Profit records a sale when it is earned; cash records it when the customer pays, which may be sixty days later or never. A business can be profitable on every line and still miss payroll, and that gap is the entire reason the discipline exists.
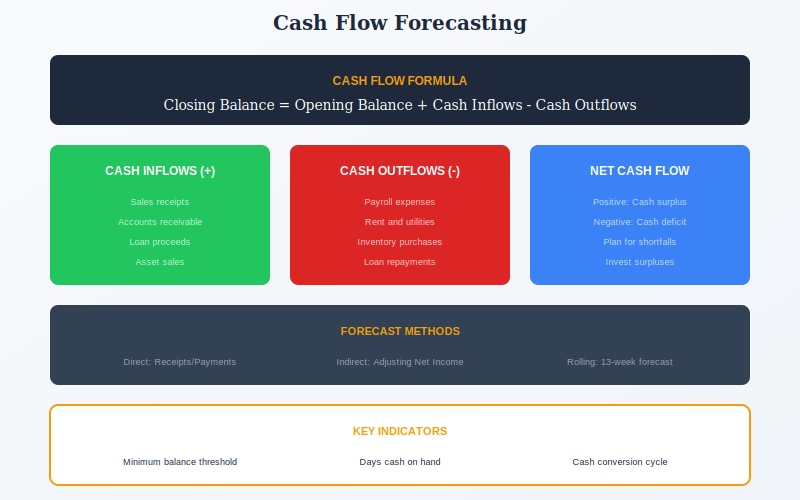
Two ways in. Build it from expected receipts and payments, invoice by invoice, which is accurate over weeks and impossible over years. Or start from projected profit and adjust for the non-cash items and the working capital movements, which works over quarters and cannot tell you about next Tuesday. The horizon decides the method, not preference.
Quick Reference
The two methods
Direct and indirect, and which to use
The difference is where you start. One begins with the bank; the other begins with the profit and loss. They answer different questions and are not interchangeable.
| Direct | Indirect | |
|---|---|---|
| Built from | Expected receipts and payments, item by item | Projected profit, adjusted for non-cash items and working capital |
| Horizon | Days to about a quarter. Degrades fast beyond that | Quarters to years. Useless for next week |
| Answers | Will we clear payroll on the 28th? | Can we fund the expansion out of operations? |
| Cost | High. Needs live receivables, payables and payroll data every week | Low. Falls out of the budget model you already have |
| Who builds it | Treasury or the finance manager, weekly | FP&A, on the planning cycle |
Most organizations need both, and run one
The common state is an indirect forecast in the annual model and nothing weekly, which means the business can see a year ahead and not a fortnight. The failure that follows is specific: a solvent, profitable company surprised by a payroll week.
The reverse also happens. A treasury team with an excellent thirteen-week view and no long forecast cannot answer whether a capital program is fundable, because the direct method has no way to reach that far.
The rolling view
Thirteen weeks, and why liquidity planning uses it
The standard short-term instrument is a thirteen-week forecast, rebuilt every week so it always looks the same distance ahead. Thirteen weeks is one quarter at weekly resolution, which is the grain at which liquidity problems actually appear.
| Horizon | Method | Decision it supports |
|---|---|---|
| 1-4 weeks | Direct, daily or weekly | Which invoices to release this week. Payroll cover |
| 13 weeks, rolling | Direct, weekly, rebuilt each week | Liquidity planning. Whether a facility is needed, and when. The working horizon for anything under pressure |
| 12 months and beyond | Indirect, monthly | Funding, covenants, capital plans, dividend capacity |
Rolling is the part that does the work
A forecast built once each quarter is at its least useful exactly when it matters, because the near weeks have already passed and the far weeks were guesses. Rebuilding weekly keeps the accurate end of the forecast permanently in front of you.
It also produces the only honest accuracy measure you will get. Every week, last week's forecast can be compared with what happened, and the same errors show up repeatedly: one customer who always pays late, a payment run that always lands a day after it was modeled.
Core Features
- Dated, not aggregated: the output is a balance per period, not a total
- The trough is the finding: lowest point and its date, against a minimum cash level
- Two methods: direct from receipts and payments, indirect from projected profit
- Horizon picks the method: weeks are direct, years are indirect
- Rolling: rebuilt each period so the accurate end stays ahead of you
- Accuracy is measurable: compare each period against actual and the errors repeat
Worked example
A building services firm in Valencia, and the week nobody saw
An illustrative composite. A Spanish mechanical and electrical contractor, around 120 staff, profitable for three years running, forecast cash monthly from the budget model.
| Stage | What happened |
|---|---|
| The monthly forecast | Every month of the year showed a positive closing balance, the lowest around EUR 340,000. Nothing looked wrong. |
| What the weekly view found | Within March, a subcontractor run and a quarterly VAT payment fell in the same week as payroll, while the two largest client receipts were due the following week. The trough was minus EUR 210,000, and the month still closed positive. |
| Why monthly hid it | Averaging inside the period. A month that opens and closes healthy can contain a week that does not, and nothing in a monthly forecast can show that. |
| What was done | The subcontractor run moved by seven days, which cost nothing and required one conversation. A EUR 250,000 overdraft facility was arranged as cover rather than drawn. |
| What the weekly cycle then showed | Two clients paid on average eleven days later than their terms, every time. Once that was modeled rather than assumed, forecast error fell by roughly two thirds. |
The period length was the whole problem
A monthly forecast cannot show a weekly trough, and there was nothing wrong with the numbers in it. The business was profitable, the annual view was accurate, and it was one conversation away from a genuine crisis in March.
Note the second finding, which only a rolling forecast produces. Two customers were reliably eleven days late. That is not an error to be reduced by better estimating; it is a fact to be built into the model.
When to Use
- Any business where receipts and payments do not arrive evenly across the month
- Growing fast, where working capital absorbs cash faster than profit produces it
- Under financial pressure, where the thirteen-week rolling view becomes the operating instrument
- Seasonal businesses, where a good year contains a dangerous quarter
- Before agreeing payment terms, since terms are a cash decision before they are a commercial one
- When approaching a covenant test or a facility renewal
When NOT to Use
- As a substitute for deciding whether the business model works
- At monthly resolution when the risk is inside the month
- Over years using the direct method, which cannot see that far
- Where nobody will act on it, since a forecast that changes no decision is bookkeeping
- To judge profitability, which it deliberately does not measure
- As a one-off exercise, because the value is almost all in the rolling comparison
In practice
How forecasts fail
Almost none of these are arithmetic. They are choices about period, method and whether anybody checks the result.
| Failure mode | What it looks like | What to do instead |
|---|---|---|
| Monthly periods, weekly risk | Every month closes positive and one week inside it does not | Forecast weekly for at least a quarter. Averaging inside the period hides exactly what you are looking for. |
| Terms modeled instead of behavior | Receipts dated on the invoice due date, when the customer has never once paid on it | Model actual payment behavior per customer. It is stable and it is knowable. |
| Never compared with actual | A forecast rebuilt each week and never checked against the last one | Compare every week. The same errors recur, and they are the cheapest accuracy you will ever buy. |
| Optimism at the near end | Receipts pulled forward and payments pushed back by whoever wants the number to look better | Separate who builds the forecast from who is judged on it. |
| Only the closing balance reported | The board sees period-end figures and never the trough | Report the low point and its date. That is the number that decides whether you need a facility. |
| One line, no range | A single projection treated as fact, with no view of what happens if a large receipt slips | Run the forecast with the two or three biggest receipts delayed. That is usually the whole risk. |
Sourced
Evidence, and how to cite it
There is no originator; the methods were codified by accounting standards.
Forecasting cash is old treasury practice with no author. What is datable is the formalization of the two methods. The US standard issued in 1987 replaced the older funds flow statement with a statement of cash flows, defined the direct and indirect presentations, and expressed a preference for direct. The international standard followed with the same two methods.
Financial Accounting Standards Board, SFAS 95, Statement of Cash Flows (1987); International Accounting Standards Board, IAS 7, Statement of Cash Flows.
The thirteen-week convention comes from restructuring practice.
It is not derived from anything. Thirteen weeks is a quarter at weekly resolution, long enough to see a facility requirement coming and short enough that the direct method still holds. It became standard through turnaround and lender reporting, where a weekly rolling view is routinely a condition of continued support.
Convention rather than a published method; documented in turnaround and treasury practice guidance rather than in a founding text.
Profitability and liquidity come apart routinely.
The reason the discipline exists is that accrual accounting records revenue when earned and cost when incurred, neither of which is when money moves. A growing business funds its own growth: more sales means more stock and more unpaid invoices, and both consume cash before the profit arrives. Growth is a common cause of failure, not a protection against it.
A direct consequence of the accruals concept, set out in the IASB Conceptual Framework and every introductory financial accounting text.
Accuracy is rarely measured, which is the actual problem.
Most organizations produce a forecast and never compare it with what happened, so the same errors repeat indefinitely. The errors are usually specific and stable rather than random: named customers who pay a predictable number of days late, payment runs that land a day after modeled. None of that is hard to fix once measured, and it is not measured because nobody owns it.
See Variance Analysis for the amount, timing and omission split that makes forecast error diagnosable.
How to cite it.
There is no framework author to cite. For the direct and indirect methods, cite the accounting standards: Harvard: Financial Accounting Standards Board (1987) Statement of Financial Accounting Standards No. 95: Statement of Cash Flows. Stamford, CT: FASB. Outside the United States, cite IAS 7. For the thirteen-week rolling forecast, cite it as market practice rather than attributing it.
Key Strengths
- Answers the question that closes businesses: liquidity, not profitability
- Gives a date: almost no other finance tool does
- Cheap fixes surface early: moving a payment run a week often costs nothing
- Accuracy improves on its own: if the rolling comparison is actually done
- Expected by lenders: a weekly rolling view is standard in any credit conversation
Key Weaknesses
- Data-hungry: the direct method needs live receivables and payables every week
- Degrades with distance: reliable over weeks, speculative over years
- Easy to bias: whoever wants a comfortable number can produce one
- Says nothing about profitability: a different question entirely
- Usually a single line: no range unless somebody adds one
- Worthless unfollowed: the value is in the weekly comparison, which is the part that lapses
Sequencing
What to run before and after
The forecast needs a plan to build on, and it produces a number somebody has to act on.
Before
Know what you intend to spend and earn
A cash forecast converts a plan into dates. Without an agreed cost base and revenue expectation there is nothing to convert, and the forecast becomes a guess with a timeline.
During
Measure the error and feed it back
Comparing each week's forecast with what happened is what makes the next one better. The split between a wrong amount and a wrong date matters, because they need different fixes.
After
Decide what the trough means
A low point below your minimum cash level is a decision, not a number: arrange a facility, move a payment, chase a receipt, or delay a capital commitment.
Common questions
Cash Flow Forecasting: quick answers
What is cash flow forecasting?
A projection of money entering and leaving a business over a stated period, presented as a balance at each date rather than a total. It answers whether there will be money in the account when it is needed, which is a different question from whether the business is profitable. The number that matters is the lowest point and the date it falls on.
What is the difference between the direct and indirect method?
Where you start. The direct method builds from expected receipts and payments item by item, and is accurate over days and weeks but impractical beyond about a quarter. The indirect method starts from projected profit and adjusts for non-cash items and working capital movements, which works over quarters and years but cannot tell you about next week. The horizon decides which you use.
What is a 13-week cash flow forecast?
A weekly forecast covering the next thirteen weeks, rebuilt every week so it always looks the same distance ahead. Thirteen weeks is one quarter at weekly resolution: long enough to see a funding requirement coming, short enough that the direct method is still reliable. It is the standard instrument for liquidity planning and is routinely expected by lenders.
How far ahead should you forecast cash?
Both near and far, using different methods. One to four weeks daily or weekly for payment decisions; thirteen weeks rolling for liquidity planning; twelve months or more monthly, using the indirect method, for funding and covenant questions. Most organizations run the long one and not the short one, which is the wrong way round if cash is tight.
Why can a profitable business run out of cash?
Because profit records a sale when it is earned and cash records it when the customer pays. Growth makes it worse rather than better: more sales means more stock and more unpaid invoices, and both consume money before the profit arrives. A company can be profitable on every line and still miss payroll in a specific week.
How do you improve cash flow forecast accuracy?
Compare every forecast with what actually happened, which most organizations never do. The errors are usually stable rather than random: particular customers pay a predictable number of days late, and particular payment runs land a day after they were modeled. Model the observed behavior rather than the agreed terms, and separate whoever builds the forecast from whoever is judged on it.
What is the difference between a cash flow forecast and a cash flow statement?
Direction in time. The statement is a historical report of cash movements in a period that has closed, and is part of the published accounts. The forecast is a projection of movements that have not happened yet, is internal, and has no prescribed format. They share the direct and indirect presentations and nothing else.
What is liquidity planning?
Making sure the business can meet its obligations as they fall due, which is what a short-horizon cash forecast is for. In practice it means running a rolling weekly forecast, watching the trough against a minimum cash level you have set in advance, and arranging facilities before you need them rather than during the week you do.
Deep Resources
Frameworks related to Cash Flow Forecasting
- Variance AnalysisSplitting forecast error into amount, timing and omission, which is how accuracy improves…
- Break-Even AnalysisThe volume threshold, for when the question is coverage rather than timing…
- Capital BudgetingWhether a multi-year commitment is worth making, once you know you can fund it…