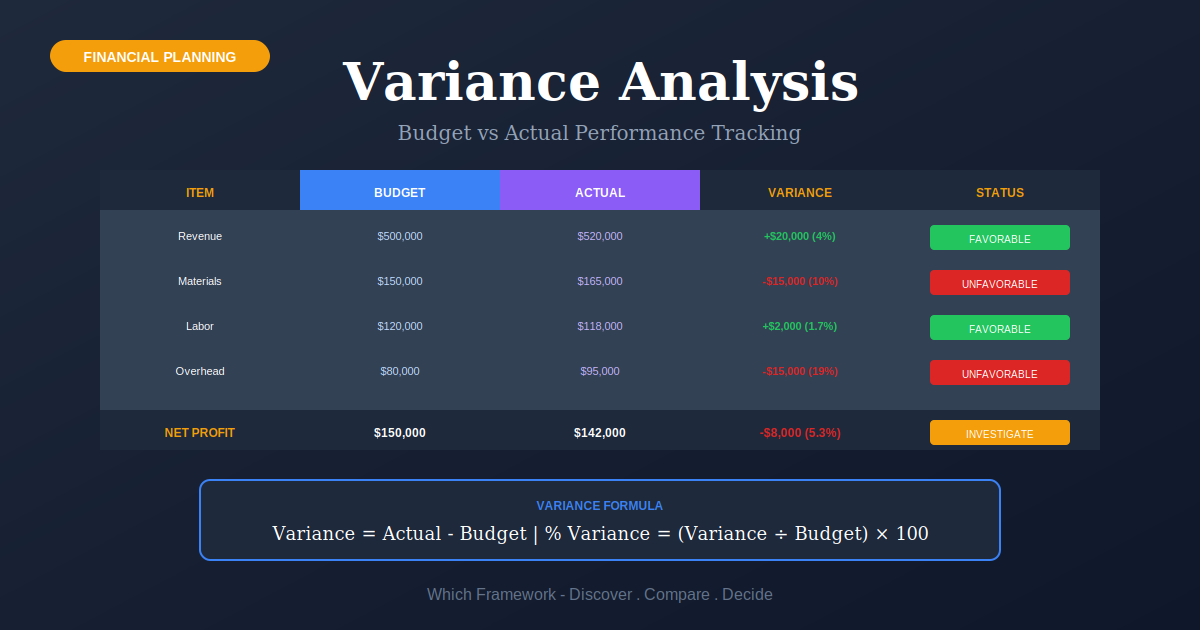
Variance Analysis: Splitting a Miss Into Price, Quantity, Mix and Timing
Variance Analysis is a control technique that compares actual results with a plan or standard and decomposes each difference into named causes such as price, quantity, mix and timing.
Before you start
Is this your framework?
Variance analysis answers one question: you missed the number, so which part of it moved. It takes a single gap between plan and actual and splits it into causes you can act on separately, rather than leaving one figure nobody can do anything with.
It is backward-looking by construction, and it explains arithmetic rather than behavior. A decomposition tells you the price moved; it never tells you why. If your problem is somewhere other than explaining a miss, the table below says where.
| If your real problem is… | You probably want |
|---|---|
| We need to build the cash forecast in the first place | Cash Flow Forecasting — producing the number. This page is about explaining the gap once actuals arrive Compare Variance Analysis and Cash Flow Forecasting |
| You mean the statistical test, comparing group means | That is ANOVA, an unrelated technique that shares the word variance. Nothing on this page applies to it |
| The budget itself is the problem, not the miss against it | Zero-Based Budgeting — rebuilding the plan rather than measuring against last year's Compare Variance Analysis and Zero-Based Budgeting |
| We want to know what volume we need to cover our costs | Break-Even Analysis — forward-looking cost structure, not a retrospective gap |
| We do not know which measures matter in the first place | KPIs — choosing what to track. Variance analysis assumes you already have a plan worth measuring against |
| Nobody reads the variance report we already produce | Dashboard Design — a presentation problem, and a common one with variance reporting |
| Costs have to come down, without cutting what customers pay for | The cost reduction playbook, where Variance Analysis is stage 1 of 4 |
| Actuals came in different from plan and nobody can say which part moved | Variance Analysis — you are in the right place |
What Is It?
A variance is the gap between what you planned and what happened. On its own the number tells you very little. Revenue was eleven percent under. Is that a price problem, a demand problem, or a customer who paid late? The single figure cannot say.
So you split it. Hold one factor still and let the other move. That breaks the gap into pieces, and each piece belongs to someone. A cost overrun becomes a price piece, which is purchasing, and a quantity piece, which is operations. Now each one can be acted on.
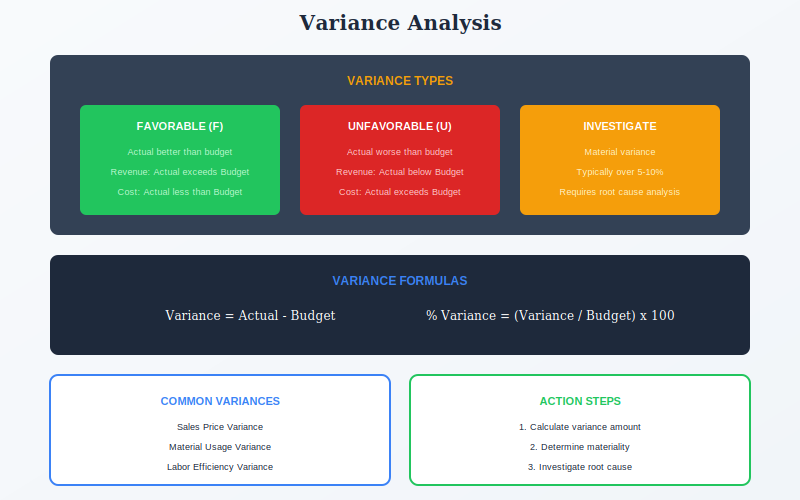
Each piece is labeled favorable or unfavorable. This is where people get misled. The words only say which way the number moved against plan. They do not say whether anything good happened. A favorable price variance from buying cheaper material is often what caused the unfavorable usage variance next to it.
Quick Reference
The decomposition
How one gap becomes several
Every version rests on one move: change a single factor at a time. Two factors give two variances that add back to the total. The math is the easy part.
| Piece | What it isolates | Whose problem |
|---|---|---|
| Price or rate | What you paid per unit against what you planned to pay, at the actual quantity | Purchasing, or the market. Often outside anyone's control |
| Quantity or usage, efficiency | How much you used against how much you planned to use, at the standard price | Operations. Usually the one worth investigating |
| Volume | How much you sold or produced against plan, holding the mix and margin still | Sales and demand, not the factory |
| Mix | The shift between products or channels, holding total volume still | The one most often skipped, and it hides the most: total volume on plan while margin collapses |
Favorable does not mean good
The pieces affect each other, and the labels hide it. Purchasing buys material at eight percent under standard and books a favorable price variance. The material is harder to work. Scrap rises. An unfavorable usage variance turns up in another report, under another manager.
Read the pieces together or the split works against you. Each one is measured by holding the other still. That is what makes them add up. It is also what hides the link running between them.
The cash case
Cash flow variance, where timing is its own cause
Applied to cash, the split needs a third piece. A budget records what was earned. A cash forecast records when the money actually moved. Those two come apart all the time.
| Piece | What happened | Effect |
|---|---|---|
| Amount | The transaction was larger or smaller than forecast | Real. Changes the total over any period you measure |
| Timing | The right amount moved, on the wrong date | Nets to zero over the quarter and can still cause a shortfall in week one. Invisible in profit, decisive for liquidity |
| Omission | A flow that was never in the forecast at all | The signal that the forecasting process has a gap, not that the estimate was wrong |
Why the timing piece has to be separated
A customer paying four weeks late changes no profit at all. Over the quarter the cash arrives and the total is right. But the business was short in week one. If that was a payroll week, somebody drew on a credit line and paid interest for it.
Merge timing into amount and you hide the one variance a treasurer can act on. An amount variance means fix the estimate. A timing variance means change the payment terms or hold more cash. One number gives you neither answer.
Core Features
- One factor at a time: hold price still to isolate quantity, and the reverse
- The pieces add back to the total: a decomposition, not an estimate
- Favorable and unfavorable: direction against plan, with no judgment attached
- Management by exception: a threshold below which nothing is investigated
- Timing as a separate piece wherever cash rather than accruals is being measured
- Retrospective: it explains a period that has already closed
Worked example
A food processor in Chonburi, and the favorable variance that cost money
An illustrative composite. A Thai fruit processing company missed its quarterly margin by about THB 4.2 million and the monthly pack reported it as a single unfavorable materials figure.
| Piece | What it revealed |
|---|---|
| Price variance | Favorable by THB 2.8 million. Purchasing had switched to a cheaper mango supplier and was reported as ahead of target for the quarter. |
| Usage variance | Unfavorable by THB 6.1 million. The cheaper fruit was smaller and less ripe, so yield per tonne fell about nine percent. The two variances were the same decision, reported to two different managers. |
| Mix variance | Unfavorable by THB 0.9 million. Volume was on plan, but the shift from chilled to canned lines carried a lower margin. Nobody had been looking at mix. |
| What changed | Purchasing and operations were reviewed against a combined materials figure rather than separately. The supplier switch was reversed for two grades and kept for one, where yield held. |
| What the analysis could not do | It located the money precisely and explained none of it. The yield finding came from a plant visit, not from the numbers. |
The decomposition found the money and stopped there
Two managers each hit their own target while the company lost THB 3.3 million between them. That is what happens when the pieces are reported separately. It is a reporting problem, not a flaw in the math.
Note where the technique stopped. It narrowed a quarterly miss to one material and one decision, in about a day. Everything after that came from people looking at fruit.
When to Use
- A monthly or quarterly close where actuals differ from plan and nobody can explain it
- Repetitive operations with stable standards, which is where the technique is strongest
- Cash forecasting, to find out whether the forecast is wrong or merely early
- Where costs have several drivers that different people control
- Post-project review against an original budget
- As the input to a rolling forecast, so the next estimate is better than the last
When NOT to Use
- Where the plan was never realistic, in which case you are measuring the plan
- In fast-changing conditions, where the standard is stale before the period closes
- For one-off or highly variable work, where there is no meaningful standard
- As a performance appraisal, which makes standards get negotiated rather than estimated
- To answer why anything happened, which requires going and looking
- Where the reporting cycle is slower than the decision cycle it is supposed to inform
In practice
How variance analysis misleads
The math is reliable. Almost every failure comes from what sits around it: what the plan was, when the report lands, and who reads which piece.
| Failure mode | What it looks like | What to do instead |
|---|---|---|
| Pieces read separately | A favorable price variance celebrated in one report while the usage variance it caused sits in another | Review interacting variances together, and against one combined figure. |
| The volume trap | Producing to stock generates a favorable overhead variance, so building inventory looks like performance | Watch what the measure rewards. This is the standard objection from lean accounting and it is a real incentive. |
| Timing merged into amount | A late receipt reported as a forecasting error, so the estimate gets revised and the collection problem persists | Separate the two. They call for different actions. |
| Reported too late | Month seven variances arriving in week three of month eight | Report the few variances that matter weekly, even roughly. Precision after the decision is worth nothing. |
| Everything investigated | Explanations demanded for every line, so the explanations become boilerplate | Set a threshold in money and percentage, and hold to it. |
| Standards negotiated, not estimated | Budgets padded because variances drive bonuses | Separate the measurement from the appraisal, or the standard stops being an estimate. |
Sourced
Evidence, and how to cite it
The variance formulae are G. Charter Harrison's, from 1920.
Harrison, an English chartered accountant working in America, installed the first full standard cost system at the Boss Manufacturing Company of Kewanee, Illinois, in 1911. He produced the first set of formulae for the analysis of cost variances in 1920, which is the technique on this page rather than standard costing generally.
Solomons, D., ‘Costing Pioneers: Some Links with the Past’, Accounting Historians Journal, 21(2); Chatfield, M., ‘Harrison, G. Charter’, in The History of Accounting: An International Encyclopedia.
The idea came from an engineer, not an accountant.
Harrison said the Boss Manufacturing system came out of Harrington Emerson's 1909 book. One chapter argued that you can only see waste by comparing what a thing cost with what it should have cost. Earlier groundwork came from George Norton in 1889, and from John Whitmore, who published the first full account of a standard cost system in 1908.
Emerson, H. (1909) Efficiency as a Basis for Operation and Wages; Whitmore, J. (1908), The Journal of Accountancy; Norton, G.P. (1889) Textile Manufacturers' Bookkeeping.
The measures reward building inventory.
Fixed overhead is spread across the units you produce. Make more units than you sell and the overhead per unit falls, which shows up as a favorable volume variance. So a manager who plays the variance report is paid to build stock nobody ordered. This is the main objection from lean accounting. It is how the measure works, not a misuse of it.
Maskell, B.H. and Baggaley, B. (2003) Practical Lean Accounting. New York: Productivity Press.
Its relevance has been contested for decades.
Johnson and Kaplan argued that management accounting had been bent to serve external reporting. The numbers arrived too late and too lumped together to manage with. Later work asked outright whether standard costing was obsolete. The fair answer is that it still works in stable, repetitive manufacturing and fits badly almost everywhere else.
Johnson, H.T. and Kaplan, R.S. (1987) Relevance Lost: The Rise and Fall of Management Accounting. Boston: Harvard Business School Press; Cheatham, C.B. and Cheatham, L.R. (1996) Accounting Horizons, 10, pp. 23–31.
How to cite it.
For the origin: Solomons, D. (1994) ‘Costing Pioneers: Some Links with the Past’, Accounting Historians Journal, 21(2), on Harrison's 1911 system and 1920 variance formulae.
For the critique: Johnson, H.T. and Kaplan, R.S. (1987) Relevance Lost. Boston: Harvard Business School Press.
For current method, cite a managerial accounting text rather than a person; the formulae have been standard for a century and are not attributed in practice.
Key Strengths
- Turns one useless number into several usable ones: each with a different owner
- The pieces reconcile: they add back to the total, so the analysis is checkable
- Cheap: the data already exists in the ledger and the forecast
- Directs attention: a threshold means only a few lines get investigated
- Improves the next forecast: particularly for cash, where the error pattern repeats
Key Weaknesses
- Explains arithmetic, not causes: the why always comes from somewhere else
- Only as good as the plan: a bad standard makes every variance meaningless
- Rewards overproduction: the volume variance is a genuine perverse incentive
- Hides interactions: the pieces are computed by holding each other still
- Often too slow: monthly reporting against decisions made weekly
- Corrupts standards when tied to pay: budgets get negotiated rather than estimated
Sequencing
What to run before and after
The technique needs a plan worth measuring against, and it stops at the point where somebody has to find out what actually happened.
Before
Build a plan the variance can mean something against
Every variance is measured from a standard. If the standard was set by adding a percentage to last year, the analysis measures the padding rather than the operation.
During
Decide what gets investigated
A report with every line explained gets read by nobody. A threshold in both money and percentage is what makes management by exception work rather than becoming a monthly ritual.
After
Go and find out why
The decomposition points at a material, a line or a customer. It has nothing to say about the cause, and the answer is usually somewhere the ledger does not reach.
Part of a playbook: How to Reduce Business Costs. Variance Analysis is stage 1 of 4, before benchmarking.
Common questions
Variance Analysis: quick answers
What is variance analysis?
A control technique that compares actual results with a plan or standard and splits the difference into named causes such as price, quantity, mix and timing. The point is that a single gap is not actionable, while its pieces have different owners and different remedies.
How do you calculate a variance?
Hold one factor still and let the other move. The price variance is the difference between actual and standard price, multiplied by the actual quantity. The quantity variance is the difference between actual and standard quantity, multiplied by the standard price. Computed that way the two pieces add back exactly to the total difference, which is what makes the analysis checkable.
What is the difference between a favorable and unfavorable variance?
Favorable means the actual was better than plan for that line, unfavorable means worse. The words describe direction only and carry no judgment. A favorable price variance from buying cheaper material is frequently the direct cause of the unfavorable usage variance beside it, so reading either alone is misleading.
What is cash flow variance analysis?
The same decomposition applied to a cash forecast rather than a budget, with one extra piece. Cash variances split into amount, where the transaction was bigger or smaller than forecast; timing, where the right amount moved on the wrong date; and omission, where a flow was never forecast at all. Timing is the piece budget variance analysis has no equivalent for.
Why does timing matter in cash flow variance?
Because it is invisible in profit and decisive for liquidity. A customer paying four weeks late nets to zero over the quarter and changes no reported margin, but the business was short in week one. An amount variance means revise the estimate; a timing variance means change the collection terms or hold more buffer. Merging them gives neither answer.
Is variance analysis the same as ANOVA?
No. ANOVA, or analysis of variance, is a statistical test comparing means across groups. Variance analysis in the accounting sense compares actual financial results with a plan and decomposes the difference. They share a word and nothing else, and the accounting technique involves no statistics at all.
What is the variance analysis cycle?
The loop most managerial accounting texts describe: prepare a performance report, analyze the variances on it, identify the questions worth asking, get explanations from the people closest to the work, take corrective action, run the next period, and begin again. The explanation step is the one that carries the value, and it happens outside the numbers.
When should you investigate a variance?
Set a threshold in both money and percentage, and hold to it. A large percentage on a small line rarely matters; a small percentage on a large one often does. Investigating everything produces boilerplate explanations and teaches people that the report is a formality.
Deep Resources
Frameworks related to Variance Analysis
- Cash Flow ForecastingProducing the forecast this technique then measures the miss against…
- Zero-Based BudgetingFor when the standard itself is the problem rather than the variance…
- KPIs (Key Performance Indicators)Choosing what is worth measuring before measuring the gap…