Break-Even Analysis: Profitability Point Calculation
Break-Even Analysis determines the point where total revenue equals total costs—the minimum sales volume needed to avoid losses. Essential for pricing, profitability, and business sustainability decisions.
What Is It?
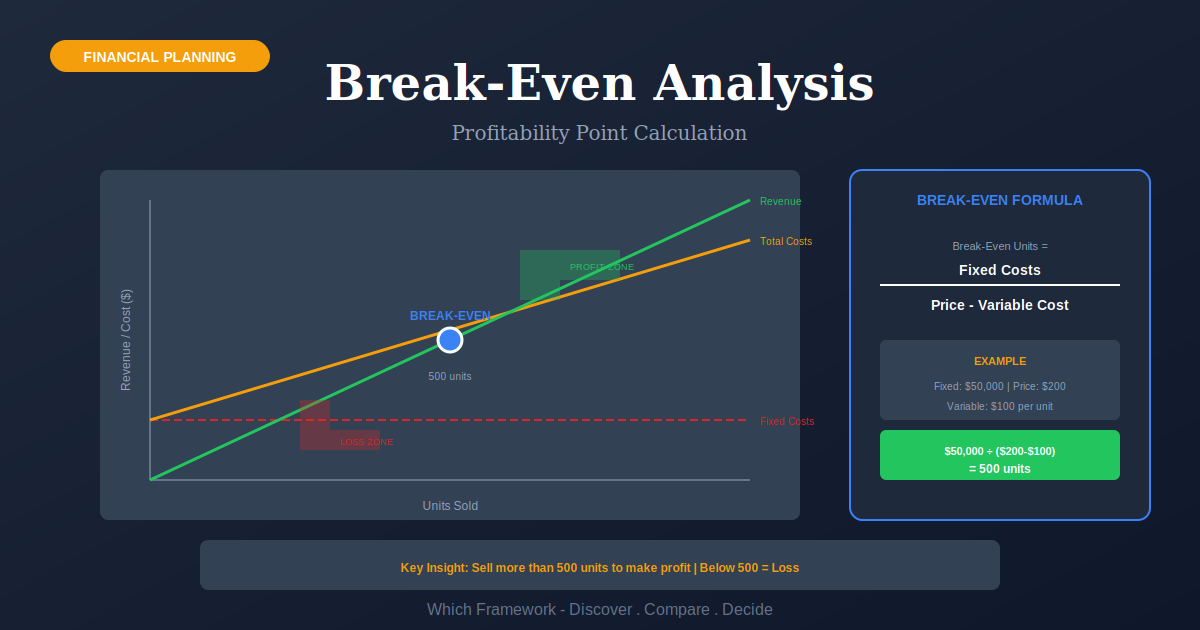
Break-Even Analysis answers a fundamental business question: "How many units must we sell to cover our costs?" Below this point, you lose money. Above it, you make profit. It's one of the simplest yet most powerful financial tools.
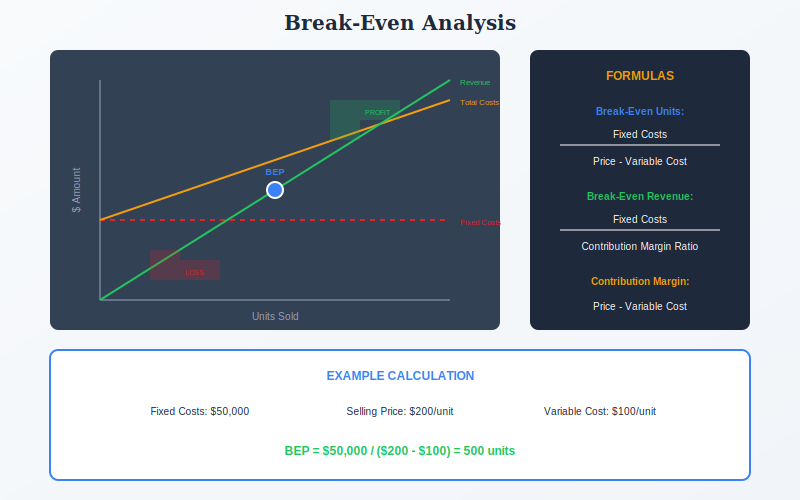
The formula is straightforward: Break-Even Units = Fixed Costs / (Price - Variable Cost). The denominator—price minus variable cost—is called the contribution margin, representing how much each unit contributes toward fixed costs and profit.
Break-Even Analysis connects to Capital Budgeting for investment decisions and Cash Flow Forecasting for financial planning.
Quick Reference
Core Features
- Break-Even Point: Units or revenue where profit = 0
- Contribution Margin: Price minus variable cost
- Fixed Costs: Costs that don't vary with volume
- Variable Costs: Costs that change with volume
- Margin of Safety: Buffer above break-even
- Target Profit: Calculate volume for desired profit
When to Use
- New product/service launch decisions
- Pricing strategy development
- Make vs. buy decisions
- Startup financial planning
- Cost reduction impact analysis
- Sales target setting
When NOT to Use
- Complex multi-product businesses
- When costs don't clearly separate into fixed/variable
- Highly volatile pricing environments
- When qualitative factors dominate
- As sole decision criterion for major investments
Key Strengths
- Simplicity: Easy to calculate and understand
- Visual: Graph makes concept immediately clear
- Practical: Direct application to pricing and volume
- Quick: Fast analysis for time-sensitive decisions
- Flexible: Easy to run "what-if" scenarios
Key Weaknesses
- Oversimplifies cost behavior
- Assumes linear relationships
- Single-product focus
- Ignores time value of money
- Doesn't account for market constraints
How It Works
| 1 Primary Input | Fixed costs, variable cost per unit, selling price per unit |
|---|---|
| 2 Data You Need | Cost classification, pricing data, volume estimates |
| 3 Primary Output | Break-even units, break-even revenue, margin of safety, target volumes |
Comparison with Related Frameworks
Break-Even Analysis vs Capital Budgeting
Capital Budgeting adds time value of money with NPV and IRR. Break-Even provides quick viability check; Capital Budgeting provides rigorous investment analysis. Use Break-Even for screening, Capital Budgeting for final decisions.
Break-Even Analysis vs Cash Flow Forecasting
Cash Flow Forecasting projects when cash comes in and goes out. Break-Even determines the volume needed for profitability. Break-Even sets targets; Cash Flow Forecasting ensures you have cash to reach them.