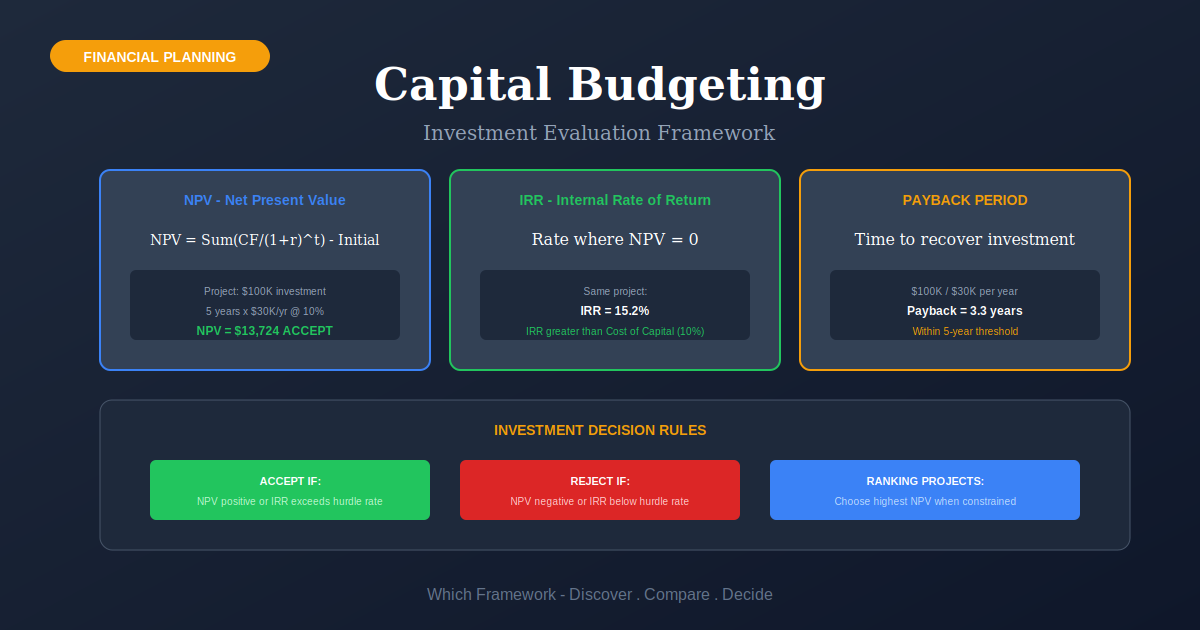
Capital Budgeting: NPV, IRR and Payback, and What to Do When They Disagree
Capital Budgeting is a process for choosing between long-term investments by projecting each one's future cash flows, discounting them to a present value, and ranking the projects on the result.
Before you start
Is this your framework?
This answers one question: of the things we could spend capital on, which are worth doing. You project each project's cash flows over its life, discount them because money arriving in year seven is worth less than money today, and rank on what comes out.
It needs cash flow estimates over years, which are the weakest numbers in any business, and a discount rate, which is a judgment dressed as a parameter. The arithmetic is exact and the inputs are not. If your question is nearer than that, the table below points elsewhere.
| If your real problem is… | You probably want |
|---|---|
| Can we afford it this quarter, not is it worth it | Cash Flow Forecasting — liquidity and dates. A project can be worth doing and still sink you in March Compare Capital Budgeting and Cash Flow Forecasting |
| What volume covers the costs of this | Break-Even Analysis — a threshold with no discounting and no time value Compare Capital Budgeting and Break-Even Analysis |
| We are choosing between features, not investments | RICE or ICE Scoring — prioritization at a scale where discounting is not worth the effort |
| The whole cost base needs justifying, not one project | Zero-Based Budgeting — rebuilding operating spend rather than appraising capital |
| The uncertainty is about which future happens at all | Scenario Planning — a single discounted number hides that entirely |
| The project might fail and we need to size that | Risk Management Framework — a discount rate is a poor place to carry project-specific risk |
| Several multi-year investments and limited capital | Capital Budgeting — you are in the right place |
What Is It?
Money has a time value. A euro in five years is worth less than a euro now, because the one you have now could be earning. So you cannot compare a project that pays back slowly with one that pays back fast by adding up the totals.
Discounting fixes that. Each future cash flow is shrunk by a rate that reflects what the money could otherwise earn, and the shrunken amounts are added together. Subtract what the project costs and you have a net present value: the amount of value the project adds, in today's money.
The rule that follows is simple, and firms routinely ignore it. Positive NPV means do it; the highest NPV wins among alternatives. Most companies calculate NPV and then decide on something else, usually the rate of return or how fast the money comes back, and that gap between theory and practice is worth understanding before you present anything.

Quick Reference
The measures
Five numbers, and what each one hides
Most appraisals produce several of these at once. They answer different questions and only one of them measures value created.
| Measure | Answers | Blind to |
|---|---|---|
| NPV net present value | How much value does this add, in today's money? | The one that measures value. Says nothing about scale of effort or how long your money is tied up |
| IRR internal rate of return | What rate of return does it earn? | Project size. A 40% return on a small project beats 18% on a large one, and the large one may add far more value |
| Payback | How long until we get our money back? | Everything after the payback date, and the time value of money entirely |
| Discounted payback | The same, with discounting applied | Still everything after the payback date |
| Profitability index | How much value per unit of capital? | Useful when capital is rationed. Ignores absolute size |
Payback survives because it answers a real question badly
It ignores discounting and everything beyond the cut-off date, and it remains one of the most used measures in practice. That is not simply ignorance. Payback is a crude proxy for risk and for liquidity, and both are real concerns that NPV does not address at all.
Report it if it helps the conversation; do not decide on it. A project with a two-year payback and a negative NPV destroys value quickly, which is not an improvement on destroying it slowly.
When they conflict
NPV against IRR, and which wins
For a single project with normal cash flows the two agree. They come apart in three specific situations, and all three favor NPV.
| Situation | What happens | What to do |
|---|---|---|
| Different sizes | A small project shows a higher percentage return; a large one adds more value | Take the NPV. You bank money, not percentages |
| Different timing | One returns cash early, one later. The ranking flips depending on the discount rate | Use NPV at your actual cost of capital |
| Sign changes | Cash flow turns negative again later, from a rebuild or a cleanup cost. Two or more IRRs exist and none is meaningful | IRR is undefined here in any useful sense. NPV still works |
The assumption buried in IRR
IRR implicitly assumes every cash flow the project throws off gets reinvested at the IRR itself. For a project showing 45%, that assumes you have an endless supply of other 45% opportunities, which is exactly what you do not have. NPV assumes reinvestment at the cost of capital, which is the defensible assumption.
IRR is not useless; it is a poor tie-breaker. It communicates well, boards understand it, and it is a reasonable screen for a single project. Ranking mutually exclusive alternatives is where it goes wrong.
Core Features
- Cash flows, not profits: depreciation is not a cash flow and does not appear
- Incremental only: what changes because of the project, with sunk costs excluded
- Discounted to today: a rate reflecting what the money could otherwise earn
- NPV is the decision rule: positive means do it, highest wins among alternatives
- Several measures reported together: and usually decided on the wrong one
- Multi-year horizon: which is why the estimates are the weak part
Worked example
A press line in Ostrava, and the project that won on the wrong number
An illustrative composite. A Czech metal forming company had capital for one of two projects. Cost of capital 9%. Both were appraised properly and the board nearly chose the wrong one.
| What the appraisal showed | |
|---|---|
| Project A automation retrofit | CZK 18 million cost. IRR 31%, payback 2.4 years, NPV CZK 9.4 million. Small, fast, and everyone liked it. |
| Project B new press line | CZK 74 million cost. IRR 19%, payback 4.8 years, NPV CZK 21.6 million. More than twice the value, on a worse-looking return. |
| What nearly happened | The paper led with IRR and payback because those are what the board asked for. On both of those measures A wins clearly, and it adds CZK 12 million less value. |
| What settled it | Reordering the paper to lead with NPV, and stating plainly that A's 31% assumed reinvesting the proceeds at 31%, which the company had nowhere to do. |
| What almost went unchecked | Both were discounted at the company-wide 9%. Project B carried a new product in a market the firm had not sold into, and a project-specific rate would have narrowed the gap. B still won. |
The presentation nearly made the decision
Nothing was miscalculated. The paper simply led with the measures the board was used to, and those measures systematically favor the smaller, faster project regardless of how much value it creates.
The discount rate point is the one that generalizes. Using one company-wide rate for every project is extremely common and quietly subsidizes risky projects while penalizing safe ones. It is worth stating in the paper even when it does not change the answer.
When to Use
- Choosing between multi-year investments when capital is limited
- Any commitment large enough that getting it wrong matters for years
- Comparing projects with different lives, sizes or cash flow patterns
- Make-or-buy and replace-or-repair decisions with long horizons
- Where a board or lender expects a discounted appraisal as standard
- Before committing, since the appraisal is worth far less afterwards
When NOT to Use
- For small or reversible decisions, where the appraisal costs more than the decision
- When the question is affordability this quarter rather than value over years
- Where cash flows genuinely cannot be estimated, in which case the precision is theater
- As the only input, since strategic fit and option value sit outside the arithmetic
- To compare against a status quo nobody has costed, which is the usual missing alternative
- Where the discount rate is set to produce a desired answer
In practice
How appraisals go wrong
The arithmetic is rarely the problem. The inputs, the rate and the order of the slides are.
| Failure mode | What it looks like | What to do instead |
|---|---|---|
| Deciding on IRR or payback | The smaller, faster project wins on percentages and adds less value | Lead the paper with NPV. Report the others as context, not as the decision. |
| One discount rate for everything | A new market venture and a like-for-like replacement both discounted at the company rate | Adjust for project risk, or at minimum say in the paper that you have not. |
| Optimistic estimates, unchallenged | Benefits from the sponsor, costs from the sponsor, and no outside view | Have someone who does not want the project build the downside case. |
| Sunk costs included | Money already spent added to the project cost to justify continuing | Only incremental future cash flows count. What is spent is gone either way. |
| No do-nothing case | Two options appraised against each other and never against carrying on | Cost the status quo. It is often the strongest option and the one nobody models. |
| Never revisited | Approved on a forecast nobody compares with the outcome | Run a post-implementation review. It is the only thing that improves the next set of estimates. |
Sourced
Evidence, and how to cite it
Joel Dean brought discounting into corporate practice.
The theory came earlier: Irving Fisher established that an asset is worth the present value of its future returns, and John Burr Williams applied discounting to valuing investments in 1938. Dean's 1951 book took it into the appraisal of capital projects, named the field, and through his consulting firm did much of the work of getting NPV and IRR adopted by American companies.
Dean, J. (1951) Capital Budgeting. New York: Columbia University Press; Fisher, I. (1930) The Theory of Interest; Williams, J.B. (1938) The Theory of Investment Value.
Firms know the theory and decide on something else.
Graham and Harvey surveyed 392 chief financial officers and found roughly three quarters always or almost always use NPV and IRR — but around 57% also use payback, which discounts nothing and ignores everything past the cut-off. Payback use concentrates in small firms and among older, longer-serving chief executives without an MBA, which the authors read as a lack of sophistication.
Graham, J.R. and Harvey, C.R. (2001) ‘The theory and practice of corporate finance: evidence from the field’, Journal of Financial Economics, 60(2–3), pp. 187–243.
Payback may not be as irrational as it looks.
A counterweight worth knowing. Rules of thumb such as payback and elevated hurdle rates can approximate the right decision when a project has option-like features — when you could wait, abandon or expand — which standard discounting handles badly. If small firms face more volatile projects, their preference for payback is less obviously a mistake.
McDonald, R.L. (1998), on real options and rules of thumb; discussed in Graham and Harvey (2001).
Most firms use one discount rate for everything.
The same survey found a majority applying a single company-wide rate to projects in new industries and new countries, and many using firm risk rather than project risk. The effect is systematic: risky projects are under-discounted and safe ones over-discounted, so the process quietly favors exactly the investments that should face the most scrutiny.
Graham and Harvey (2001), on the use of firm risk in place of project risk.
How to cite it.
Harvard: Dean, J. (1951) Capital Budgeting. New York: Columbia University Press.
For what firms actually do, cite Graham and Harvey (2001), Journal of Financial Economics, 60(2–3), pp. 187–243.
For the underlying theory, cite Fisher (1930) or Williams (1938). The individual formulas are not attributed in practice and a corporate finance text is the right reference for method.
Key Strengths
- Makes different projects comparable: different lives, sizes and timing on one measure
- NPV measures value directly: in money, not percentages
- Forces the assumptions into the open: someone has to write down the cash flows
- Well understood: boards, lenders and investors all expect it
- Handles rationed capital: the profitability index ranks value per unit of capital
Key Weaknesses
- Precision on weak inputs: multi-year cash flows are the softest numbers you have
- The discount rate is a judgment: and small changes move the answer a lot
- One rate for everything is normal: which systematically favors risky projects
- Blind to option value: the ability to wait, abandon or expand is worth something
- Says nothing about liquidity: a positive NPV project can still break the cash forecast
- Easy to reverse-engineer: adjust the rate or the terminal value until it clears
Sequencing
What to run before and after
Appraisal assumes you can estimate the cash flows and fund the commitment. Neither comes from this process.
Before
Check you can actually fund it
A positive NPV project with an outflow in a week you were already short is not affordable. Value and liquidity are different tests and a project has to pass both.
During
Test the estimates rather than the arithmetic
The formula will not be wrong. The volume assumption, the price assumption and the terminal value will be, and a single discounted number conceals how much rests on them.
After
Compare the outcome with the appraisal
Approval is the last time most projects are examined. Without a review comparing what happened with what was promised, the estimating never improves and the same optimism is funded again.
Common questions
Capital Budgeting: quick answers
What is capital budgeting?
The process of deciding which long-term investments a business should make. Each candidate's future cash flows are projected over its life and discounted back to present value, because money arriving later is worth less than money now. Subtracting the cost gives net present value, and a positive figure means the project adds value.
What are the main capital budgeting methods?
Net present value, internal rate of return, payback period, discounted payback, and profitability index. NPV is the only one that measures value created. IRR gives a rate of return but ignores project size. Payback tells you how quickly the money comes back and ignores both discounting and everything after that date.
What is the difference between NPV and IRR?
NPV gives an amount of value in today's money; IRR gives a percentage return. They agree for a single conventional project and disagree in three cases: projects of different sizes, projects with different cash flow timing, and projects whose cash flow turns negative again later, which can produce more than one IRR. NPV is correct in all three.
Which capital budgeting method is best?
Net present value, on theory that is not seriously disputed. It measures value added in money, handles any cash flow pattern, and assumes reinvestment at the cost of capital rather than at the project's own return. The practical difficulty is that boards find percentages and payback periods easier to discuss, so papers get led with the wrong measure.
Why do companies still use payback if it is flawed?
Because it answers questions NPV does not. It is a crude proxy for risk and for liquidity, both of which are real concerns. A survey of 392 chief financial officers found around 57% always or almost always use it, concentrated in smaller firms. There is also an argument that rules of thumb like payback approximate the right answer where a project has option-like features. Report it; do not decide on it.
What discount rate should you use?
In principle, a rate reflecting the risk of that specific project, usually built from the weighted average cost of capital and adjusted where the project is riskier or safer than the business as a whole. In practice most firms apply one company-wide rate to everything, including ventures into new industries, which under-discounts risky projects and over-discounts safe ones.
Should sunk costs be included in a capital budgeting analysis?
No. Only cash flows that change because of the decision belong in the appraisal. Money already spent is gone whether you proceed or not, so including it can only distort the answer. It is a common error because it usually appears as an argument for continuing rather than as a line in the model.
What is the profitability index?
The present value of a project's future cash flows divided by its initial cost, so it expresses value per unit of capital. It is most useful when capital is rationed and you are choosing a set of projects rather than one, since the highest-NPV project may absorb budget that several smaller ones would use better.
Deep Resources
Frameworks related to Capital Budgeting
- Cash Flow ForecastingWhether you can fund the commitment, which value alone does not tell you…
- Break-Even AnalysisThe volume threshold, for decisions too small to justify discounting…
- Scenario PlanningFor uncertainty that a single discounted number conceals entirely…