Playbook
How to Reduce Business Costs
Four questions, asked in order, before anything gets cut.
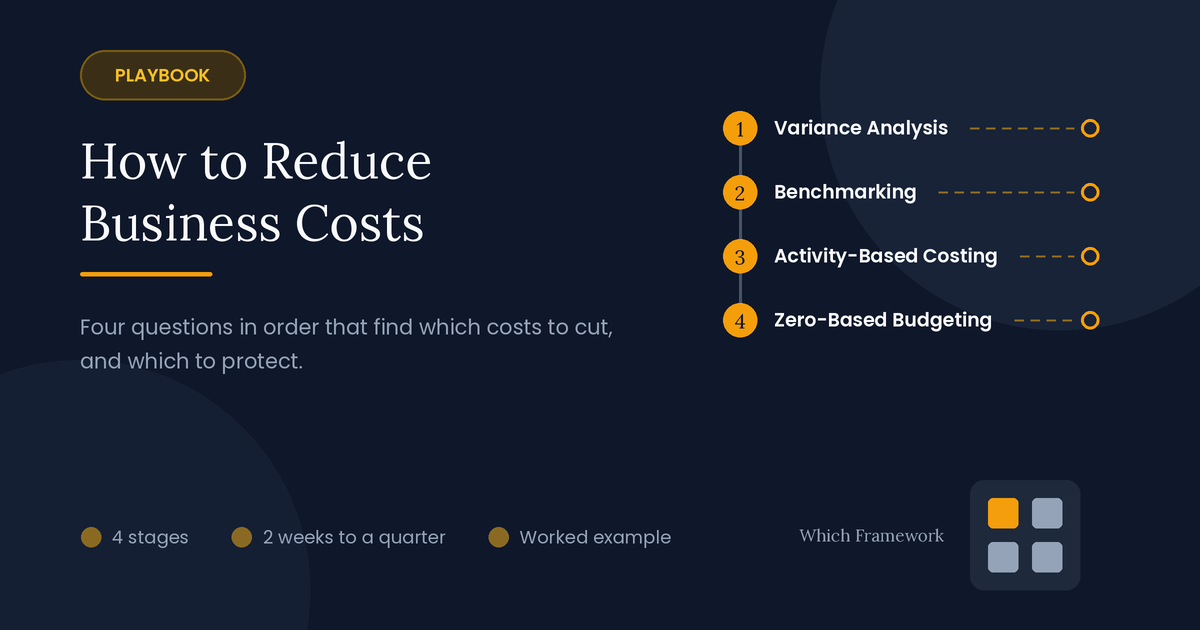
A cost reduction playbook is a four-stage sequence of financial tools that finds where costs run over, which are out of line and what drives them, then rebuilds the budget from zero.
The route
Four questions, in order
Across-the-board cuts, such as 10% from every department, are quick to announce and usually cut the wrong things. This playbook narrows down first: where costs ran over, which are out of line, what drives them, and only then what to fund. Four points on the route stop a cut that would do more harm than good.
On timing: stages 1 to 3 take six to ten weeks, and stages 2 and 3 can overlap. Stage 4 fits the yearly budget cycle. After that, the stage 1 tool runs every month to check that the savings arrive.
-
Where did costs run over?Stage 1 · Variance Analysis
Passes on: each overrun split into named causes, with an owner for each
The overrun is mostly price?Talk to purchasing and customers, not operations.
-
Which costs are out of line?Stage 2 · Benchmarking
Passes on: the cost areas where you spend more than comparable businesses
The gap is a deliberate choice?Keep it, and write down why.
-
What actually drives the costs?Stage 3 · Activity-Based Costing
Passes on: the true cost of each product and customer, and what drives it
A product or customer loses money?Reprice it, or set minimums, before cutting.
-
What would you fund from zero?Stage 4 · Zero-Based Budgeting
Passes on: next year's budget, rebuilt and ranked, with what didn't make it
A cut hits what customers pay for?Protect it, and cut lower down the list.
- Are the savings actually arriving?Then · Monthly variance reports
The example
One company, followed all the way through
This playbook follows one company from start to finish. It is an illustrative composite, and the details are simplified.
A 600-person maker of car wiring harnesses in Sousse, Tunisia, sells about EUR 48 million a year to carmakers in Europe. Its operating margin has fallen from 7% to 2% in two years. The owners want it back above 6%. The finance director's first draft cuts every department's budget by 12%, quality included. Nobody has asked which costs grew, or why.
Each stage below ends with what the company produced at that step, so you can watch one stage's output become the next stage's input.
Stage 1 of 4
Where did costs run over plan, and why?
Tool: Variance Analysis · Time: 1 to 2 weeks
Start with last year's own numbers. Variance Analysis compares what was actually spent with what was planned, and splits each difference into named causes, such as price, quantity, mix and timing. One overrun becomes several, each with its own owner.
Each piece is labeled favorable or unfavorable. Those words only say which way the number moved against plan, not whether anything good happened. A favorable price from cheaper material often causes the unfavorable usage next to it.
Last year's copper overrun, split in two
Total copper overrunEUR 1.88 million unfavorable
- Price variance(actual price − standard price) × actual quantity: (EUR 8.60 − EUR 8.00) × 1.8 million kg = EUR 1.08 million unfavorable
- Usage variance(actual quantity − standard quantity) × standard price: (1.8 − 1.7 million kg) × EUR 8.00 = EUR 0.80 million unfavorable
- What it meansThe price piece is the world copper price, so it belongs to purchasing and sales. The usage piece is scrap, which belongs to operations
Look for the large pieces, and ask who could change each one. A cost driven by a market price needs a different answer from one driven by how the work is done. Overruns caused by the business doing more, such as higher sales volume, aren't overruns at all; split them out first, so they don't hide the real ones.
| Overrun | Amount | Main cause | Owner |
|---|---|---|---|
| Copper | EUR 1.88 million | Price, then scrap | Purchasing; operations |
| Freight | EUR 0.90 million | Air freight for late orders | Planning |
| Overtime | EUR 0.40 million | Rework of faulty harnesses | Quality |
Handed to stage 2: three overruns with owners. Two of them, scrap and air freight, come from how the work is done, not from prices.
Decision point
If an overrun is mostly price, talk to purchasing and customers, not operations. Here, EUR 1.08 million came from the world copper price, which no supplier contract can change much. The company used two levers instead. With its copper suppliers, it fixed part of next year's price in advance. With its own customers, the carmakers, it agreed a copper clause, common in this industry, that adjusts harness prices when copper moves. Neither involved a cut on the factory floor.
Stage 2 of 4
Which costs are out of line with others?
Tool: Benchmarking · Time: 2 to 4 weeks
Your own plan only tells you where you overspent against yourself. Benchmarking compares your costs with a reference point outside, to show which are high by any standard. It comes in four types, by how far you look.
The four types of benchmarking, by distance
- 1Internal
- One plant or team against another in the same company
- 2Competitive
- Against direct competitors, often through industry surveys
- 3Functional
- One function against the same function in another industry
- 4Generic
- A process against whoever does it best, in any industry
Compare like with like: cost per unit of output, not total spend, and businesses of similar size and type. For cost work, competitive figures from an industry association are usually the most useful start. Check how each figure is defined before comparing it; the same word can cover different costs in different companies.
Not every gap is waste, and this is the step most often skipped. A cost that is high because of a choice, such as faster delivery that customers pay for, is a strength. Mark those, and leave them out of the cuts.
| Cost area | This company | Industry median | Gap |
|---|---|---|---|
| Direct labor | 14% | 14% | None |
| Scrap and rework | 4.1% | 1.5% | Large |
| Freight | 3.2% | 2.0% | Large |
| Overhead functions | 11% | 8% | Large |
| Quality engineers at customer sites | 1.2% | 0.6% | A choice: customers pay for it |
Handed to stage 3: three cost areas out of line: scrap, freight and overhead. The customer-site engineers are expensive by design, and stay.
Decision point
If a gap is a deliberate choice, keep it, and write down why. Otherwise the next round of cuts removes it. Here, the customer-site engineers are one reason carmakers keep ordering.
Stage 3 of 4
What actually drives those costs?
Tool: Activity-Based Costing · Time: 4 to 6 weeks
Benchmarking shows which costs are high. Activity-Based Costing shows who causes them. Most accounts spread overhead by volume, so a small, fiddly order looks as cheap to serve as a large, simple one. ABC assigns overhead in two stages instead.
Activity-Based Costing's two stages
- 1First stage
- Overhead is gathered into a cost pool for each activity, such as machine setups
- 2Second stage
- Each pool flows to products and customers by a cost driver, such as the number of setups
A cost driver is a measure of how much demand something places on an activity. Divide each pool by its driver to get a rate, such as EUR 500 per setup, and charge each product or customer for what it actually uses.
| Activity | Cost pool | Cost driver | Driver units a year | Rate |
|---|---|---|---|---|
| Machine setups | EUR 2.4 million | Setups | 4,800 | EUR 500 per setup |
| Engineering changes | EUR 1.8 million | Change requests | 600 | EUR 3,000 per change |
| Quality inspection | EUR 2.0 million | Inspection hours | 40,000 | EUR 50 per hour |
| Order handling and shipping | EUR 3.4 million | Shipments | 17,000 | EUR 200 per shipment |
The result usually points the same way: small and complex orders cost far more to serve than anyone thought, and large standard ones far less.
The driver data usually exists already, in the planning system, the shipping log or the engineering change records. A year of it is enough. Precision matters less than direction.
| Customer type | Share of sales | Margin, old method | Margin with ABC |
|---|---|---|---|
| Large carmaker programs | 78% | 3% | 9% |
| Small custom orders | 22% | 1% | −14% |
Handed to stage 4: small custom orders lose money once their setups, engineering changes and shipments are counted. They also cause much of the scrap and air freight that stage 2 flagged.
Decision point
If a product or customer loses money, reprice it or set minimums before cutting anything. The company set a minimum order size and a setup charge for custom work. Half the custom customers accepted; the rest left, taking their losses with them.
Stage 4 of 4
What would you fund if you started from zero?
Tool: Zero-Based Budgeting · Time: 6 to 8 weeks, once a year
Now rebuild the budget. Zero-Based Budgeting justifies every activity from nothing, instead of starting from last year's figure. Each activity is written up as a decision package: what it does, what it costs, and what happens at a lower or higher level of funding.
One decision package, at three levels
Decision packagePlanning team
- Minimum: EUR 180,000Two planners. Late orders go by air when needed
- Current: EUR 240,000Three planners, as today
- Improved: EUR 300,000Four planners and a scheduling tool. Air freight falls by about EUR 600,000 a year
Managers then rank every package against the others, and money is given out down the list until it runs out. What sits below the line isn't funded. Use stages 1 to 3 to rank: packages that cut scrap, air freight or loss-making work rise, whatever their size.
Note that spending can go up. The planning team's improved package costs more and saves far more, so it ranked near the top. Zero-based does not mean lower; it means every amount has a reason.
| Rank | Package | Cost | Funded? |
|---|---|---|---|
| 1 | Customer-site quality engineers | EUR 0.9 million | Yes |
| 2 | Scrap reduction project | EUR 0.4 million | Yes |
| 3 | Planning team, improved level | EUR 0.3 million | Yes |
| … | … | … | Funding runs out here |
| 18 | Trade show program | EUR 0.6 million | No |
| 19 | Second inspection of every batch | EUR 0.7 million | No: scrap work makes it unnecessary |
Handed on: a budget about EUR 2.4 million lower than last year's spending, with quality funded first and the cuts falling on activities that the evidence showed didn't earn their cost.
Decision point
If a cut hits what customers pay for, protect it and cut lower down the list. The first draft's 12% from quality would have saved EUR 110,000 and put the largest customer program at risk.
Pace
Fast track or thorough
The fast track suits a small business, or a first pass before a budget deadline. The thorough run suits a business with many products and customers, where overhead hides the true cost. The order of the stages stays the same at either pace.
| Stage | Fast track (two to three weeks) | Thorough (one quarter) |
|---|---|---|
| 1. Variance Analysis | The five largest overruns | Every budget line over a set size |
| 2. Benchmarking | One industry survey | Several sources, by cost area |
| 3. Activity-Based Costing | Three or four activities | Every major activity, with data |
| 4. Zero-Based Budgeting | Overhead functions only | The whole budget |
Failure modes
How cost cutting goes wrong
| What happens | What it looks like | The fix |
|---|---|---|
| Cutting across the board | Every department loses 10%, wanted or not | Narrow down with stages 1 to 3 first |
| Blaming operations for prices | Factory cuts to cover a market price rise | Split price from usage in stage 1 |
| Cutting what customers pay for | Quality falls, and orders follow | Mark deliberate gaps in stage 2 |
| Keeping loss-making work | Costs cut, while small orders still lose money | Reprice or set minimums in stage 3 |
| Never checking the savings | The new budget, and the old spending | Monthly variance reports, as below |
| Cutting the improvers | Projects that cut scrap go first, as discretionary | Rank by what each package saves, not its size |
After the playbook
Checking that the savings arrive
Run the stage 1 tool, Variance Analysis, every month against the new budget. A saving that exists only in the budget is not a saving. The variance report shows, line by line, whether spending has actually changed, and who owns each gap.
Pick a few measures to track as KPIs: here, scrap as a share of material, air freight per month, and margin on custom orders. The company's operating margin was back to 6.4% within four quarters. For costs that move with sales, break-even analysis shows how the new cost base changes the volume you need.
Run the whole playbook again in two to three years, or sooner if the monthly variances start to grow. Costs creep back by habit unless someone keeps asking what each one is for.
Common questions
Cost reduction: quick answers
What is a decision package in zero-based budgeting?
A short write-up of one activity: what it does, what it costs, and what would happen at a lower and a higher level of funding. Managers rank all the packages against each other, and money is handed out down the list until it runs out. Packages below the line are not funded.
How do you benchmark costs against competitors?
Compare cost per unit of output, not total spending, with businesses of similar size and type. Industry associations and published surveys are the usual sources. Treat a gap as a question, not a verdict: some costs are high because customers pay for what they buy.
How do you reduce business costs without hurting the business?
Narrow down before cutting. Find where costs ran over plan and why, which costs are high against comparable businesses, and what really drives them. Then rebuild the budget from zero, protecting anything customers pay for. Across-the-board cuts skip all of this, and usually cut the wrong things.
Why are across-the-board budget cuts a bad idea?
They treat every cost as equally wasteful. Departments that were already lean lose capability, while the real sources of cost, such as scrap or loss-making customers, are left in place. They are quick to announce, which is most of their appeal.
What is the difference between a price variance and a usage variance?
A price variance is the cost of paying more or less per unit than planned. A usage variance is the cost of using more or fewer units than planned. They usually have different owners: purchasing for price, operations for usage.
What does Activity-Based Costing show that normal costing doesn't?
The true cost of serving each product or customer. Normal costing spreads overhead by volume, so complex, low-volume work looks cheaper than it is. ABC charges overhead by what each one actually uses, which often reveals products or customers that lose money.
Is zero-based budgeting worth the effort?
Usually for overhead and discretionary spending, especially when costs have grown by habit. It takes much more work than adjusting last year's budget, so many companies apply it to a few functions each year rather than the whole budget at once.
Which costs should not be cut?
The ones customers pay for, and the ones that prevent larger costs elsewhere. A quality team that keeps a major customer, or planning that avoids air freight, can save more than it costs. Benchmarking and Activity-Based Costing help tell these apart from waste.
Frameworks in this playbook
- Variance AnalysisStage 1: Where did costs run over plan, and why?
- BenchmarkingStage 2: Which costs are out of line with others?
- Activity-Based CostingStage 3: What actually drives those costs?
- Zero-Based BudgetingStage 4: What would you fund if you started from zero?
- KPIsAfter: the few cost measures tracked monthly
- Break-Even AnalysisAfter: what the new cost base means for volume