Activity-Based Costing: How ABC Allocates Overhead
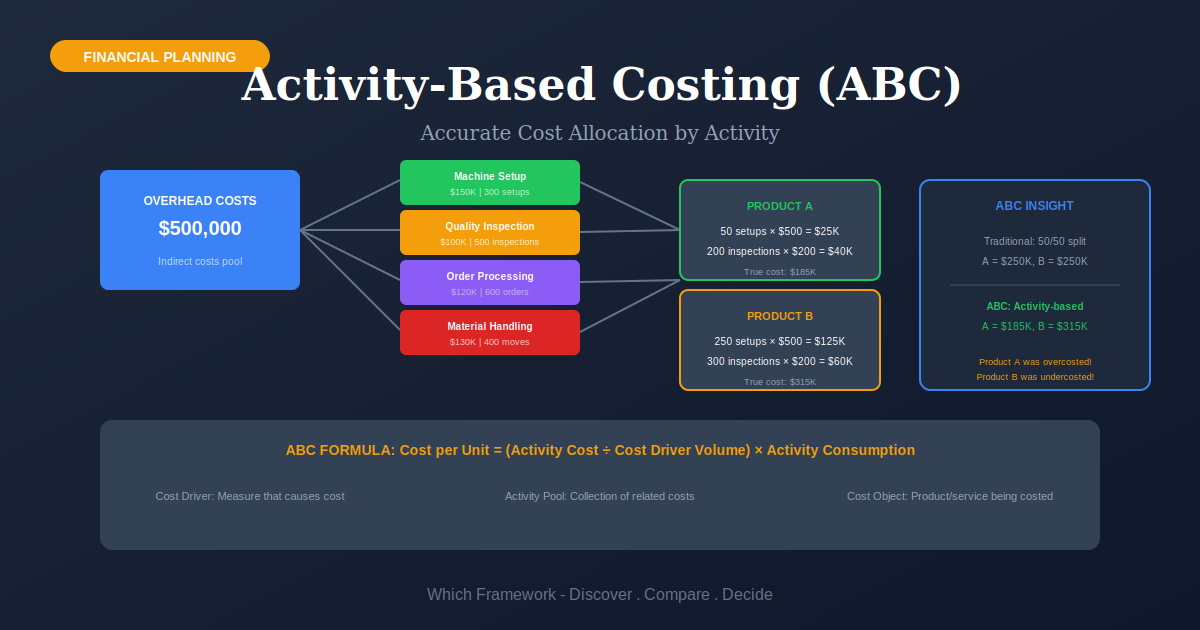
Activity-Based Costing (ABC) is a costing method that assigns overhead in two stages: first into a cost pool for each activity, then to products according to how much of each activity a product consumes.
Before you start
Is ABC your framework?
ABC pays for itself in one situation: overhead is a large share of total cost, and your products or customers place very different demands on the support work. Both halves are necessary. If overhead is small, spreading it more accurately changes little. If every product runs through the plant the same way, a single plant-wide rate is already close enough.
A second test decides whether the model survives. Name the decision that would change. If prices are set by the market, order minimums cannot be imposed and the mix is fixed, a better cost number is interesting rather than useful, and nobody will maintain it.
| If your real problem is… | You probably want |
|---|---|
| We need to know why actual spending differs from what we budgeted | Variance Analysis — explains the gap between plan and actual, which is a different question from what a product costs Compare ABC and Variance Analysis |
| We need every cost justified from scratch rather than carried forward | Zero-Based Budgeting — decides which costs should exist at all, where ABC decides who should carry the ones that do Compare ABC and Zero-Based Budgeting |
| We need to see where work waits and piles up, not what it costs | Value Stream Mapping — time and flow on one page, rather than money |
| One step limits everything we can produce | Theory of Constraints — throughput at the bottleneck, not cost per unit |
| Overhead is small, and every product runs through the same steps | A single plant-wide rate. ABC would cost more to build than the distortion it removes is worth. |
| Overhead is large, and we suspect some products or customers are subsidizing others | Activity-Based Costing — you are in the right place |
What Is It?
Overhead is every cost that is not traced directly to a product — supervision, scheduling, purchasing, quality control, machine setup, the building itself. Traditional costing spreads all of it across products using one plant-wide rate tied to volume, usually direct labor hours or machine hours. That works when overhead is small and products are similar. It stops working when overhead grows and products differ.
It stops working because much overhead is not caused by volume. Setting up a machine costs about the same whether the run that follows makes ten units or ten thousand. Raising a purchase order costs the same either way. A volume-based rate charges those costs in proportion to units made, so the products that make the most units absorb the most of them, even when they caused almost none.
ABC inserts a step. Overhead is first gathered into a cost pool for each activity, which is a piece of work the organization performs, such as setting up machines or handling orders. Each pool gets a cost driver: a measure of how much demand something places on that activity, such as the number of setups. Costs then flow from each pool to each cost object — a product, a product line, a customer — in proportion to the driver units it consumes.
The direction of the result is usually the same everywhere. High-volume, simple products turn out to cost less than the old system reported. Low-volume, complex ones cost considerably more. The gap between the two systems measures how much the first group has been subsidizing the second.
ABC sits alongside Zero-Based Budgeting, which questions whether a cost should exist, and Variance Analysis, which explains why spending differed from plan.
Quick Reference
The mechanism
How ABC allocates overhead
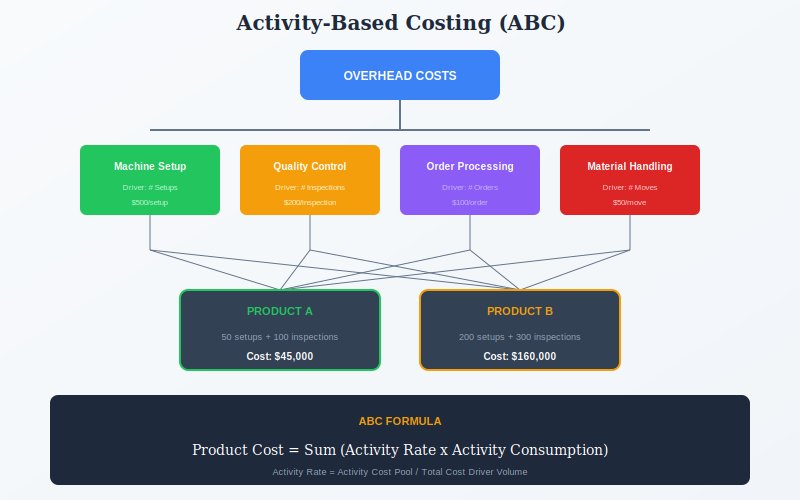
Activity-based cost systems allocate costs by focusing on activities. That is the whole difference, and it happens in two stages. First, overhead moves from the general ledger into a cost pool for each activity. Second, each pool is charged out to products using its own rate. One formula governs that second stage.
The activity cost allocation rate
Activity rate = activity cost pool ÷ total volume of the cost driver
Overhead charged to a product is then the activity rate multiplied by the driver units that product consumes, added up across every activity.
The plant below has $600,000 of overhead a year, three activities and two products: a standard chair made in long runs, and a custom chair made in short ones. The first table works out the three rates.
| Activity | Cost pool | Cost driver | Total driver volume | Activity rate |
|---|---|---|---|---|
| Machine setups | $180,000 | Number of setups | 300 setups | $600 per setup |
| Purchasing | $150,000 | Number of purchase orders | 1,000 orders | $150 per order |
| Machine running | $270,000 | Machine hours | 30,000 hours | $9 per machine hour |
The second table charges those rates to the two products, then sets the answer against a single plant-wide rate for comparison. That rate is $600,000 divided by 30,000 machine hours, or $20 per machine hour.
| Standard chair 20,000 units | Custom chair 2,000 units | |
|---|---|---|
| Setups consumed | 60 × $600 = $36,000 | 240 × $600 = $144,000 |
| Purchase orders consumed | 200 × $150 = $30,000 | 800 × $150 = $120,000 |
| Machine hours consumed | 24,000 × $9 = $216,000 | 6,000 × $9 = $54,000 |
| Total overhead under ABC | $282,000 | $318,000 |
| Overhead per unit under ABC | $14.10 | $159.00 |
| Overhead per unit, traditional at $20 per machine hour | $24.00 | $60.00 |
What the two systems disagree about
Both systems allocate exactly $600,000. They disagree completely about who should carry it. The custom chair costs about two and a half times what the old system reported, and the standard chair costs 40% less.
The cause is batch work. The custom chair takes four times as many setups and four times as many purchase orders as the standard chair, while making one tenth as many units. Setups and purchase orders do not scale with volume, but a machine-hour rate assumes that everything does. So the standard chair, which runs long and quietly, was picking up the cost of interruptions it never caused.
Not all overhead behaves alike
The four levels of cost
Robin Cooper set out a hierarchy in 1990 that explains why the numbers above move the way they do. Overhead sits at four levels, and each responds to something different. Choosing a driver from the wrong level is the commonest technical error in building an ABC model.
| Level | What triggers the cost | Typical drivers | Where it goes wrong |
|---|---|---|---|
| Unit | Each unit produced. Power, materials handling, machine running time. | Units, machine hours, labor hours | Rarely. Traditional costing handles this level correctly. |
| Batch | Each batch handled, whatever its size. Setups, purchase orders, inspections, deliveries. | Number of setups, orders, inspections, shipments | This is the level traditional costing gets wrong. It charges batch costs as though they scaled with units. |
| Product | Keeping a product line available at all. Design, engineering changes, testing, regulatory filings. | Number of products, engineering change notices | Spread over units, so a low-volume product looks cheap while carrying a full design load. |
| Facility | Keeping the site open. Rent, insurance, plant management, security, heat and light. | None that is not arbitrary | Allocated anyway, inventing precision. Cooper and Kaplan argued these should be left out of product decisions. |
The last row is the one most often ignored. There is no non-arbitrary way to say how much of the roof a particular chair used. Allocating facility costs anyway produces a full cost per unit that looks authoritative and answers no real question. It is also the main reason ABC numbers get misread as the cost that would disappear if you stopped making something.
Core Features
- Two-stage allocation: ledger to activity pools, then pools to products
- Multiple rates: one per activity, instead of one for the whole plant
- Cause-based drivers: each rate is tied to what actually triggers the work
- A cost hierarchy: unit, batch, product and facility costs treated differently
- Cost objects beyond products: customers, channels and orders can be costed the same way
- Cross-subsidies made visible: the gap against the old system is the finding
Worked example
A bakery, and the accounts it nearly dropped
An illustrative composite. A specialty bakery near Portland, Oregon, with about $42 million in revenue and $8.4 million of overhead. Gross margin had held steady for three years while operating margin fell, and nobody could say which accounts were responsible.
| Step | What it produced |
|---|---|
| Activities | Nine activities carried almost all the overhead. The five that mattered were line changeovers, order handling, cold-storage picking, delivery stops and quality holds. |
| Drivers | Changeovers were driven by the number of recipe switches, not by loaves baked. That one choice moved more cost than every other decision in the model. |
| The finding | The three largest grocery accounts made up 61% of volume but absorbed 24% of changeover cost. Forty small regional accounts made up 12% of volume and absorbed 47%, because they ordered small batches with frequent recipe changes. |
| The proposal | Drop the forty smallest accounts. They carried $1.9 million of allocated overhead against $2.4 million of contribution, so on the ABC numbers most looked marginal. |
| What they did instead | Modeling showed only about $600,000 of that $1.9 million would actually disappear, because the plant, the freezer and the quality team would all remain. They raised prices on eleven accounts, set a minimum order quantity, and kept two unprofitable accounts on purpose. |
The distinction the numbers do not make for you
ABC reports average cost, not avoidable cost. Dropping the forty accounts would have removed $2.4 million of contribution and roughly $600,000 of spending. The other $1.3 million would simply have moved onto the remaining accounts, which would then have looked worse than the month before. That is a cycle which ends with a very accurate cost model and no customers.
Working out what is avoidable means asking, activity by activity, whether the capacity would really be removed. Cooper and Kaplan called this the difference between the cost of resources supplied and the cost of resources used. The value here was in pricing and the minimum order quantity, which is where ABC usually pays. It is far less often a case for dropping anything.
When to Use
- Overhead is a large share of total cost, and growing
- Products, orders or customers place very different demands on support work
- Margins look healthy in aggregate but operating profit is drifting
- You set your own prices, or can change order minimums and terms
- You are deciding on product mix, outsourcing, or which customers to serve
When NOT to Use
- Overhead is a small fraction of cost, so the distortion is not worth removing
- Every product moves through the same steps in similar batch sizes
- Prices are set by the market and terms cannot be changed
- The purpose is inventory valuation for financial reporting, which has its own rules
- Nobody will own the model once the consultants leave
In practice
How ABC goes wrong
ABC fails in well-documented ways, and the documentation is unusually candid because much of it was written by the people who created the method.
| Failure mode | What it looks like | What to do instead |
|---|---|---|
| Too many activities | Several hundred activities, a model nobody can explain, a rebuild needed whenever anything changes | Start with the dozen activities carrying most of the overhead. Add detail where a decision needs it. |
| Average cost read as avoidable cost | A product or customer is dropped, the allocated overhead moves onto whatever is left, and margins get worse | Before acting, work out which capacity would actually be removed, activity by activity. |
| Survey-based time estimates | Staff asked what share of their week goes to each activity; the answers always total 100%, so idle capacity vanishes | Estimate practical capacity for each resource, and let unused capacity show as unused rather than hide inside the rates. |
| Allocating facility costs | Rent and plant management pushed onto products, producing a full cost no decision can rest on | Report facility-level costs separately, and leave them out of product and customer comparisons. |
| Built once, never updated | A model reflecting a product mix from three years ago, still quoted in pricing meetings | Agree a refresh cycle and an owner before you build. A stale cost model is worse than none, because it is believed. |
Sourced
Evidence, and how to cite it
ABC dates from 1988, and the idea behind it from 1971.
The method arrives in a Harvard Business Review article of September–October 1988, alongside a series Robin Cooper wrote for the Journal of Cost Management. The 1987 date often attached to ABC belongs to Relevance Lost, a different book by Thomas Johnson and Robert Kaplan, which diagnoses management accounting rather than proposing this method. The older ancestor is George Staubus, who argued in 1971 that activities rather than products should be the objects of costing. That is a real antecedent, not a misattribution: Cooper and Kaplan built the two-stage method that is taught and examined, and Staubus did not.
Cooper, R. & Kaplan, R.S. (1988) ‘Measure costs right: make the right decisions’, Harvard Business Review, 66(5), pp. 96–103; Staubus, G.J. (1971) Activity Costing and Input-Output Accounting. Homewood, IL: Richard D. Irwin.
One of ABC’s creators published a replacement for it.
In Harvard Business Review in November 2004, Robert Kaplan and Steven Anderson wrote that ABC looks excellent in the classroom, but that managers who tried it at scale had often given up. What defeated them was the cost of building the model and the irritation of surveying staff over and over. Their answer was Time-Driven ABC, which needs only two estimates: what it costs to supply capacity per unit of time, and how long each transaction takes.
Kaplan, R.S. & Anderson, S.R. (2004) ‘Time-driven activity-based costing’, Harvard Business Review, 82(11); and (2007) Time-Driven Activity-Based Costing. Boston: Harvard Business School Press.
Not every cost should be allocated to a product.
Cooper’s hierarchy separates unit, batch, product and facility costs, and facility costs have no driver that is not arbitrary. Cooper and Kaplan later drew a second distinction, between the cost of resources supplied and the cost of resources used. That is the one telling you whether spending would actually fall if a product went away. A full cost per unit hides both points, which is why ABC output gets misread as a case for dropping something.
Cooper, R. (1990) ‘Cost classification in unit-based and activity-based manufacturing cost systems’, Journal of Cost Management; Cooper, R. & Kaplan, R.S. (1992) ‘Activity-based systems: measuring the costs of resource usage’, Accounting Horizons.
How to cite it.
Harvard: Cooper, R. and Kaplan, R.S. (1988) ‘Measure costs right: make the right decisions’, Harvard Business Review, 66(5), pp. 96–103.
APA: Cooper, R., & Kaplan, R. S. (1988). Measure costs right: Make the right decisions. Harvard Business Review, 66(5), 96–103.
For the cost hierarchy, cite Cooper (1990). For Time-Driven ABC, cite Kaplan and Anderson (2004). For the older idea of activity costing, cite Staubus (1971).
Key Strengths
- Finds cross-subsidies: the gap against the old numbers is the whole point
- Supports pricing: gives a defensible basis for surcharges and order minimums
- Works on customers too: the same method costs channels, orders and accounts
- Shows what drives spending: the driver list is itself a description of the business
- Argues from cause: a rate tied to setups is easier to defend than one tied to volume
Key Weaknesses
- Expensive to build and keep: the reason its own creators published a successor
- Average cost, not avoidable cost: the numbers do not say what would go away
- False precision: arbitrary facility allocations look as solid as measured ones
- Judgment in the drivers: the driver choice can decide the answer before the arithmetic
- Goes stale quietly: a model of last year’s product mix still returns confident numbers
Sequencing
What to run before and after
ABC sits between two things it depends on: knowing what the work actually is, and having a decision to make with the answer.
Before
Establish that overhead is worth the trouble
Work out what share of total cost is overhead, and how far the mix varies. If overhead is 8% and every product runs the same way, the distortion you would remove costs less than the model does.
During
Get the activity list from the people doing the work
The activities and drivers decide the answer, so they should come from the floor rather than the ledger. Process mapping produces the list far faster than interviews alone.
After
Turn the numbers into a decision, carefully
Separate what is average from what is avoidable before anything gets cut. Then use the result where it works best: prices, order minimums, terms, and where to put capacity next year.
Common questions
Activity-based costing: quick answers
Activity-based cost systems allocate costs by focusing on what?
On activities. Traditional costing spreads overhead using a single volume measure, such as direct labor hours or machine hours. ABC adds a step in between. Overhead is first collected into a pool for each activity, then charged to products according to how much of each activity a product consumes.
What is the activity cost allocation rate formula?
The activity rate is the activity cost pool divided by the total volume of its cost driver. If a setup pool holds $180,000 and the plant performs 300 setups a year, the rate is $600 per setup. The overhead charged to a product is that rate multiplied by the driver units the product consumes.
How do you calculate activity-based costing step by step?
Five steps. Identify the activities that consume overhead. Collect the overhead into a cost pool for each one. Choose a cost driver that measures demand for each activity. Divide each pool by its total driver volume to get an activity rate. Multiply each rate by the driver units a product consumes, then add the results.
What is the difference between activity-based costing and traditional costing?
The number of rates, and what they are tied to. Traditional costing uses one or two plant-wide rates based on volume, so a product absorbs overhead in proportion to units made. ABC uses a separate rate for each activity, so a product absorbs overhead in proportion to the work it demands. High-volume simple products usually look more expensive under traditional costing than they are.
What are the four levels in the ABC cost hierarchy?
Unit-level costs are incurred for every unit produced. Batch-level costs are incurred each time a batch is handled, however many units it holds, and cover setups, purchase orders and inspections. Product-level costs support a whole product line regardless of volume, such as design work. Facility-level costs keep the site open. Robin Cooper set out the hierarchy in 1990.
What is Time-Driven ABC, and did it replace ABC?
Time-Driven ABC is Robert Kaplan's own successor, published with Steven Anderson in Harvard Business Review in 2004 and as a book in 2007. They wrote that many companies had abandoned conventional ABC because it cost too much to build and maintain. Time-Driven ABC needs only two estimates: the cost of supplying capacity per unit of time, and how long each transaction takes.
Who created activity-based costing?
Robin Cooper and Robert Kaplan, at Harvard Business School, in articles beginning in 1988. The usual citation is their Harvard Business Review paper Measure Costs Right: Make the Right Decisions. The idea has an older ancestor: George Staubus published Activity Costing and Input-Output Accounting in 1971, treating activities rather than products as the objects of costing.
How do I cite activity-based costing?
Harvard style: Cooper, R. and Kaplan, R.S. (1988) 'Measure costs right: make the right decisions', Harvard Business Review, 66(5), pp. 96-103. APA style: Cooper, R., & Kaplan, R. S. (1988). Measure costs right: Make the right decisions. Harvard Business Review, 66(5), 96-103. For the cost hierarchy cite Cooper (1990); for Time-Driven ABC, Kaplan and Anderson (2004).
Deep Resources
Frameworks related to Activity-Based Costing
- Zero-Based Budgeting (ZBB)Budgeting method requiring every expense to be justified from zero each cycle rather than…
- Variance AnalysisSystematic comparison of actual results against budget to explain and act on the difference…
- Resource Allocation MatrixFramework for distributing people, budget and capacity across competing demands…