Playbook
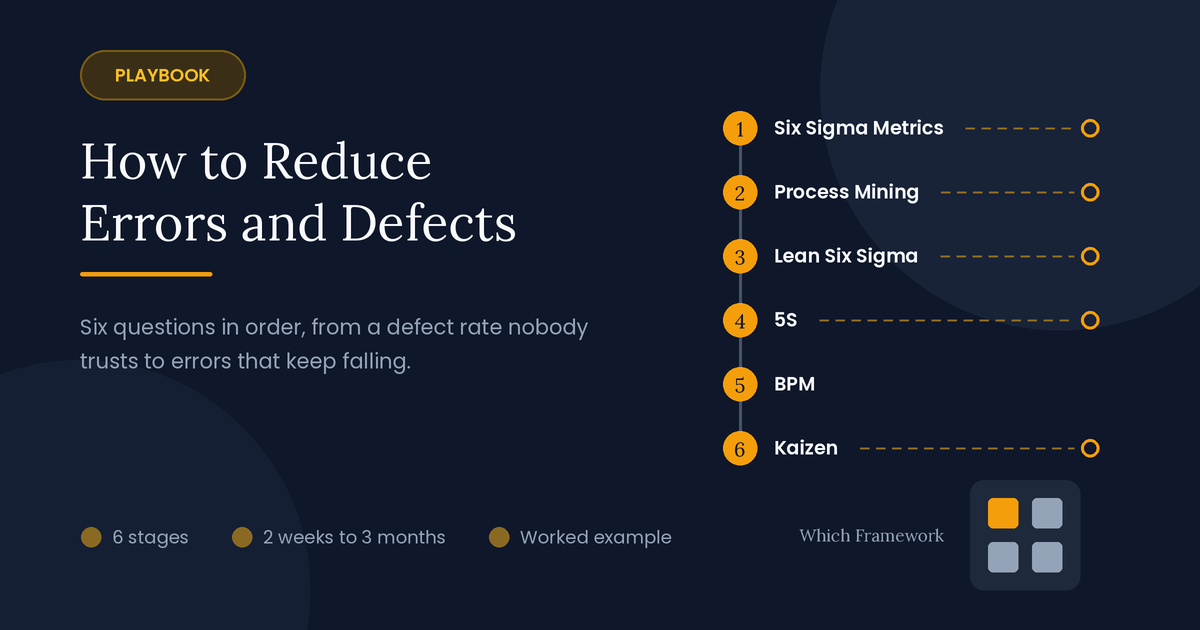
How to Reduce Errors and Defects
Six questions, asked in order, for work that keeps going wrong.
An errors and defects playbook is a six-stage sequence of quality tools that measures how often a process goes wrong, finds where and why, and fixes the causes so the gains hold.
The route
Six questions, in order
The route follows DMAIC, the cycle Lean Six Sigma uses: stage 1 measures, stages 2 and 3 analyze, stage 4 improves, and stages 5 and 6 make the gain hold.
On timing: stages 1 to 3 take four to eight weeks, stage 4 about a week per work area. Stages 5 and 6 start during stage 4, then keep going.
Is the work slow rather than wrong? See How to Speed Up a Slow Business Process.
-
How often do errors happen?Stage 1 · Six Sigma Metrics
Passes on: a defect rate you can defend, by type
Two people count it differently?Agree what a defect is first.
-
Where in the process do they start?Stage 2 · Process Mining
Passes on: the paths with the most errors
Paths all look alike?Look at what comes in, not the steps.
-
Why do they happen?Stage 3 · Lean Six Sigma (DMAIC)
Passes on: causes proven with evidence
A fix proposed before a cause is proven?Send it back.
-
How do you make the right way the easy way?Stage 4 · 5S
Passes on: a work area where a mistake looks wrong
Can't spot a problem from the doorway?It's tidier, not safer.
-
Who owns the whole process?Stage 5 · Business Process Management
Passes on: one owner, and one measure end to end
-
How do errors keep falling?Stage 6 · Kaizen
Passes on: small improvements, every week
Suggestions going unanswered?Answer them before asking for more.
- Are errors still falling?Then · Track the rate monthly
The example
One company, followed all the way through
This playbook follows one company from start to finish. It is an illustrative composite, and the details are simplified.
A medicine distributor in Manila, the Philippines, buys from drug makers, its suppliers, and delivers to about 3,000 pharmacies, its customers. Its warehouse ships about 100,000 order lines a month; an order line is one product on one pharmacy's order.
Pharmacies complain of wrong items, wrong quantities and stock close to expiry. Each error costs about PHP 900 (Philippine pesos) in a return trip, a second pick and a credit note. The warehouse manager blames careless pickers and wants a second check on every order.
Each stage below ends with what the company produced at that step, so you can watch one stage's output become the next stage's input.
Stage 1 of 6
How often do errors happen, and what do they cost?
Tool: Six Sigma Metrics · Time: 2 to 3 weeks
Start by putting a number on it. Six Sigma Metrics express quality as one rate: count what went wrong, divide by how many chances there were for something to go wrong, and scale it to a million. That is defects per million opportunities, or DPMO, and from it comes a sigma level: the higher, the fewer defects.
The number rests on two definitions: what counts as a defect, and how many opportunities for one each unit holds. Write both down before counting, and keep them fixed.
The defect rate, worked for one month
Defects per million opportunities (DPMO)Defects ÷ (units × opportunities per unit) × 1,000,000
- Units and opportunities100,000 order lines, each with 4 chances to go wrong: item, quantity, expiry date, damage
- The rate3,280 ÷ (100,000 × 4) × 1,000,000 = 8,200 DPMO
- As a sigma levelAbout 3.9 sigma, using the usual 1.5 sigma drift allowance, stated as such
Then split the defects by type, and by who found them. Defects caught inside the business cost rework; defects found by customers cost trust as well.
One exception to the order: if the work area is so disordered that nobody trusts the counts, do a first pass of 5S, from stage 4, before measuring.
| Defect | Count | Share | Found by the pharmacy, not the warehouse |
|---|---|---|---|
| Wrong item, including the wrong strength | 1,345 | 41% | 72% |
| Wrong quantity | 1,082 | 33% | 55% |
| Stock within six months of expiry | 492 | 15% | 90% |
| Damaged | 361 | 11% | 40% |
Handed to stage 2: 8,200 DPMO, costing about PHP 3 million a month, and most of the errors reaching pharmacies before anyone in the warehouse spots them.
Decision point
If two people would count the same order differently, agree the definitions before going on. A rate nobody trusts can't show whether a fix worked. Here, the warehouse and customer service had each counted damaged cartons differently.
Stage 2 of 6
Where in the process do errors start?
Tool: Process Mining · Time: 2 to 4 weeks
Errors rarely start everywhere. Process mining reads the records your systems already keep and rebuilds how the process actually runs, path by path. It needs an event log: for each item, a case number, what happened, and when.
| Case: order line | Activity | Time |
|---|---|---|
| L-482011 | Released to the warehouse | Mon 08:02 |
| L-482011 | Code typed in by hand at the shelf | Mon 08:41 |
| L-482011 | Packed | Mon 09:15 |
| L-482011 | Returned by the pharmacy: wrong strength | Wed 16:20 |
Compare the paths the data shows with the process as written down. The gap is usually large, and it is made of workarounds everyone thinks too ordinary to mention. Then work out each path's error rate.
| Path | Share of lines | Lines with an error | Share of all errors |
|---|---|---|---|
| Scanned at the shelf, checked at packing | 79% | 1.2% | 29% |
| Code typed in by hand at the shelf | 14% | 12.5% | 54% |
| Picked from the overflow area | 7% | 8% | 17% |
Handed to stage 3: one path to explain: 14% of lines have their code typed in by hand, and they carry more than half the errors. The written process says every pick is scanned.
Decision point
If the real process matches the written one and errors are spread evenly, look at what comes in, not at the steps. The cause may be a supplier, a form or a system. Here the paths differed sharply, so the route went on.
Stage 3 of 6
Why do errors happen there?
Tool: Lean Six Sigma (DMAIC) · Time: 2 to 4 weeks
Lean Six Sigma runs improvement projects through five phases, DMAIC. Stage 1 covered the first two. This stage is the third: find the cause, with evidence.
DMAIC: the five phases and the question each answers
- DDefine
- What problem?
- MMeasure
- How bad?
- AAnalyze
- Why?
- IImprove
- What change?
- CControl
- Will it hold?
List every cause people suspect, then test each one against the data. The phase exists to rule causes out. Teams under pressure use it to confirm what they suspected in week one, and stop at the first cause that fits.
| Suspected cause | How it was tested | Result |
|---|---|---|
| Pickers rush at the end of a shift | Typed codes by hour of the day | Flat all day: ruled out |
| Shelf labels the scanner can't read | Typed codes by shelf, against label age | 71% at 260 shelves with labels over three years old: proven |
| Look-alike strengths stored side by side | Wrong-item rate next to another strength | Three times the usual rate: proven |
| Overflow stock has no fixed place | Error rate in overflow against the main area | 8% against 1.2%: proven |
| New pickers | Errors by months in the job | Higher in the first month only: minor |
Handed to stage 4: three proven causes, all in how the warehouse is set up, and one blamed cause, careless pickers, ruled out.
Decision point
If someone proposes a fix before the cause is proven, send it back. The manager's second check on every order would have cost about 30 staff and fixed none of the three causes.
Stage 4 of 6
How do you make the right way the easy way?
Tool: 5S · Time: about a week for each work area, then a weekly check
Now change things, one at a time, so you can tell which change worked. All three proven causes here were about how the work area was set up, which is what 5S fixes. 5S puts a work area into a known, marked condition, so that anything wrong stands out.
The five steps of 5S
- 1Sort
- Remove what isn't needed for current work
- 2Set in order
- A marked place, item and quantity for everything left
- 3Shine
- Inspection done through cleaning
- 4Standardize
- The condition, written and shown, that makes the first three normal
- 5Sustain
- The habit and the check that keep it
Make the right way the easy way. Where a step can be made impossible to get wrong, do that too. Here the scanner stopped accepting a typed code without a supervisor's badge.
| Step | What changed |
|---|---|
| Sort | 1,100 doubtful cartons red-tagged and moved out for 30 days |
| Set in order | New labels on 260 shelves; look-alike strengths moved apart, with a color band each; fixed places in overflow |
| Shine | Pickers check labels and clean scanners at the start of each shift |
| Standardize | A photo of each aisle's standard at the aisle end |
| Sustain | A 10-minute audit every week, with the score posted |
Handed to stage 5: typed codes down from 14% of lines to 3% in the first two aisles, and then across the warehouse.
Decision point
Stand in the doorway. If you can't tell that something is wrong, the area is tidier, not safer. A missing label should leave a visible gap; a carton in the wrong place should look wrong.
Stage 5 of 6
Who owns the whole process, across every department?
Tool: Business Process Management · Time: 2 to 3 weeks to set up, then a monthly review
Some errors start outside the warehouse. Business Process Management treats a whole chain of work that crosses departments as one thing to be owned and improved for good, not as a project with an end date.
Three Business Process Management terms
- 1As-is process
- How the work runs today, workarounds and all
- 2To-be process
- The redesigned version you intend to run instead
- 3Process owner
- One named person accountable for the whole chain, across departments
Map the chain from the customer's order to the customer's satisfaction, and give it one owner and one measure from start to finish. Each department measuring only its own part is how an error in one becomes a cost in another.
| Department | What it measured | Its part in the errors |
|---|---|---|
| Purchasing and receiving | Discounts won from suppliers | Accepted stock close to expiry for a better price |
| Warehouse | Lines picked per hour | The typed codes and look-alike strengths |
| Transport | Deliveries on time | Damage from loose loading |
| Customer service | Credits issued within 48 hours | None; it saw every error last |
Handed to stage 6: the head of operations as process owner, DPMO from order to pharmacy as the one measure, and an expiry rule written into purchasing's targets.
Decision point
When the project ends, will one named person still be accountable for the whole process? If the answer is a committee, or whichever department touches it last, the gains will decay the moment attention moves.
Stage 6 of 6
How do errors keep falling after the project ends?
Tool: Kaizen · Time: starts during stage 4, then every day
A project fixes the errors you know about. Kaizen finds the next ones. It gets everyone making small improvements as part of ordinary work, and rests on three commitments.
Kaizen's three commitments
- 1Small
- A change small enough to try this week, and undo if it fails
- 2Everyone
- Improvement is part of every job, not a specialist's
- 3Where the work happens
- Designed at the shelf, not in a meeting room; the Japanese word is gemba
The usual form is a short daily meeting where the work is done, and a board for suggestions. Kaizen produces little in its first months, and it fails far more often on managers than on staff: every suggestion needs an answer, quickly and visibly, even the small ones.
| Suggestion | Answered | Result |
|---|---|---|
| Put the fastest-selling strengths at waist height | In 2 days | Tried in one aisle, then everywhere |
| A red bin for cartons that arrive damaged | In 4 days | Damage claims to suppliers doubled |
| Longer scanner cables | In 6 days | Not done; the new scanners are cordless. The picker was told why |
Handed on: about 30 small changes in the first quarter, most of them from pickers.
Decision point
If suggestions go unanswered for more than a week, stop asking for more until they are answered. An unanswered suggestion teaches people not to make the next one.
Pace
Fast track or thorough
The fast track suits a single team with an obvious hot spot. The thorough run suits a process that crosses departments, where the cause is unknown and errors are expensive. The order of the stages stays the same either way.
| Stage | Fast track (about two weeks) | Thorough (two to three months) |
|---|---|---|
| 1. Six Sigma Metrics | A month of complaints, counted | Definitions agreed, and the counting checked |
| 2. Process Mining | Fifty items followed by hand | Three months of system records |
| 3. Lean Six Sigma | The team's suspected causes, each checked once | Every cause tested with data |
| 4. 5S | The area where most errors start | Every area, with weekly audits |
| 5. BPM | A named owner | Owner, to-be process and shared measure |
| 6. Kaizen | A suggestion board | Daily meetings at the work area |
Failure modes
How efforts to reduce errors go wrong
| What happens | What it looks like | The fix |
|---|---|---|
| Blaming people | Warnings and retraining, and the same errors | Look for the cause in the process first |
| Adding inspection | A second check on everything, and costs to match | Prevent the error at the step where it starts |
| Fixing before proving | Changes that miss the real cause | Test each cause with data in stage 3 |
| Changing everything at once | Errors fall, and nobody knows why | One change at a time, measured |
| Nobody owns the chain | Each department hits its target; errors continue | One process owner and one measure |
After the playbook
Tracking the defect rate
Track DPMO every month with the definitions from stage 1, as one of your KPIs, and the share of errors customers find before you do. In the example, DPMO fell from 8,200 to about 3,000 in six months, and the second check on every order was never needed.
When the rate stops falling, run stages 2 and 3 again. The causes found first are rarely the last ones.
Common questions
Errors and defects: quick answers
How do you reduce errors and defects in a process?
Measure the defect rate with fixed definitions, find where in the process the errors start, prove why they happen, then change the work area so the right way is the easy way. Give the whole process one owner, and keep small improvements coming from the people doing the work.
How do you calculate DPMO?
Divide the number of defects by the number of units times the opportunities for a defect in each unit, then multiply by a million. 3,280 defects in 100,000 order lines with 4 opportunities each is 8,200 DPMO.
What is a good sigma level?
It depends on what an error costs. Many business processes run at three to four sigma, roughly 67,000 to 6,000 defects per million. Six sigma, the method's name, means 3.4 per million once the usual drift allowance is applied. Compare your own rate over time, with the definitions fixed, before comparing it with anyone else's.
What is DMAIC?
The five-phase cycle Lean Six Sigma runs improvement projects through: Define what the problem is, Measure how bad it is, Analyze why it happens, Improve it with a tested change, and Control it so the gain holds. A full DMAIC project usually takes months.
Can you use process mining without special software?
For a small process, yes: export the event records to a spreadsheet and sort them by case and time to see each item's path. Without records, follow 50 to 100 items through by hand and note every step and every time one is sent back.
Does 5S work in an office?
Yes, applied to whatever the work uses: shared folders, forms, templates and desks. The test is the same as on a shop floor: can someone tell at a glance when something is missing or in the wrong place?
Should you add more inspection to reduce errors?
Usually not as the main fix. Inspection catches errors after they happen and adds cost to every unit. Find where errors start and prevent them there, and keep inspection for the few checks where an escaped error is very costly.
Frameworks in this playbook
- Six Sigma MetricsStage 1: How often do errors happen, and what do they cost?
- Process MiningStage 2: Where in the process do errors start?
- Lean Six Sigma (DMAIC)Stage 3: Why do errors happen there?
- 5SStage 4: How do you make the right way the easy way?
- Business Process ManagementStage 5: Who owns the whole process, across every department?
- KaizenStage 6: How do errors keep falling after the project ends?
- Value Stream MappingInstead: when the work is slow, not wrong
- KPIsAfter: the defect rate tracked monthly