Playbook
How to Reduce Customer Churn
Five questions, asked in order, for customers who keep leaving.
A customer churn playbook is a five-stage sequence of research and prioritization tools that finds who leaves, why and where the experience breaks, then picks the fixes that keep the most customers.
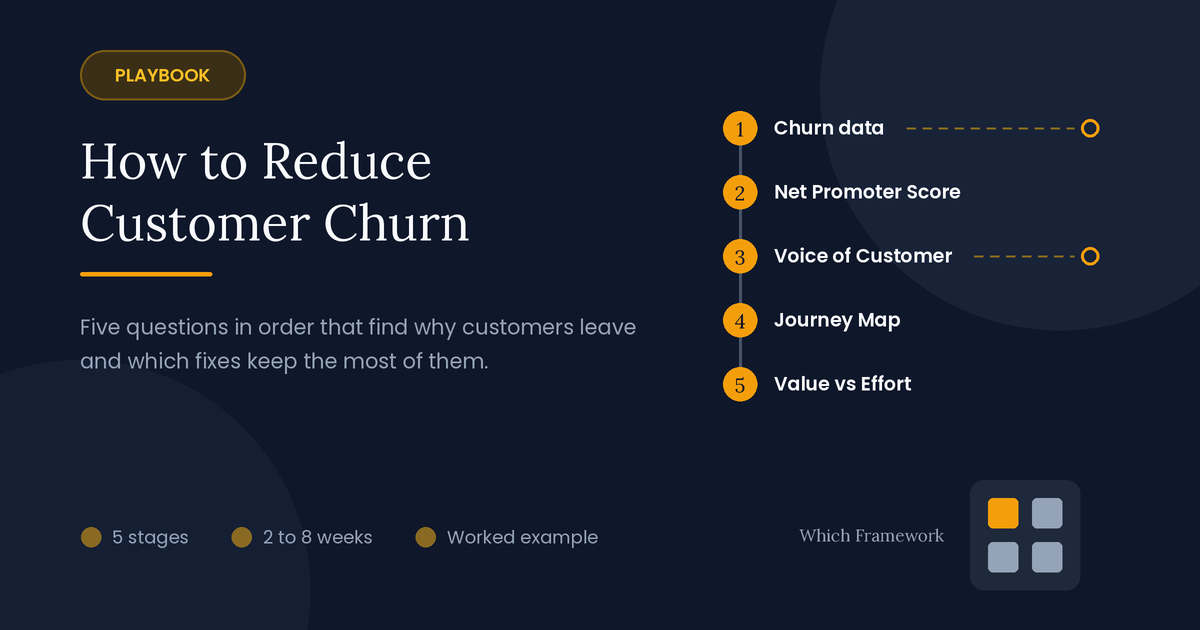
The route
Five questions, in order
Churn is the share of customers who cancel, or stop buying, in a given period. This playbook finds where it happens, why, and which fixes keep the most customers. Stage 1 uses your own data; the other four use proven tools.
On timing: stage 1 comes first, because it tells you whom to survey and interview. Stages 2 and 3 can overlap, since conversations with customers who have already left can start while the survey runs.
-
Who leaves, and when?Stage 1 · No framework: your own customer data
Passes on: where churn is concentrated, by customer type and by time
Can't tell who leaves?Fix the data before anything else.
-
Who is likely to leave next?Stage 2 · Net Promoter Score
Passes on: current customers sorted by loyalty, with the unhappy ones named
-
Why do customers leave?Stage 3 · Voice of the Customer
Passes on: the needs that go unmet, ranked
Everyone says price?Ask what happened just before they decided.
-
Where does the experience break?Stage 4 · Customer Journey Mapping
Passes on: the moments where the experience breaks, and ideas to fix each
-
Which fixes come first?Stage 5 · Value vs Effort Matrix
Passes on: quick wins to start now, and the larger projects worth funding
- How do you know churn is falling?Then · Track it monthly, by customer group
The example
One company, followed all the way through
This playbook follows one company from start to finish. It is an illustrative composite, and the details are simplified.
A home internet provider in Cairo, Egypt, has about 180,000 subscribers. Each month around 3% of them cancel, so the company has to win 5,400 new customers a month just to stand still. Marketing wants a bigger discount for people who threaten to leave. Nobody has asked why they leave in the first place, or whether all customers leave at the same rate.
Each stage below ends with what the company produced at that step, so you can watch one stage's output become the next stage's input.
Stage 1 of 5
Who leaves, and when?
No framework: your own customer data · Time: 1 to 2 weeks
Start with the facts you already hold. No framework can tell you who is leaving; your own records can. Split the customers who canceled in the last year by how long they had been customers, and by any grouping that matters: plan, region, how they signed up.
Churn is almost never spread evenly. It usually bunches at one point, often the first few months, or among one group. Finding that point tells you where to aim every later stage, and whom to survey and interview.
Work the rate out for each group the same way: customers lost in the month, divided by customers in that group at the start of the month. A group's rate compared with the average shows where to look.
The churn rate, worked for one month
Monthly churn rateCustomers who canceled in the month ÷ customers at the start of the month
- The whole base5,400 ÷ 180,000 = 3%
- Customers in their first three months1,944 ÷ 21,600 = 9%, three times the average
| Months as a customer | Share of customers | Cancel each month | Share of all cancellations |
|---|---|---|---|
| 1 to 3 | 12% | 9% | 36% |
| 4 to 12 | 28% | 3% | 28% |
| 13 or more | 60% | 1.8% | 36% |
Handed to stage 2: the hot spot: customers in their first three months are 12% of the base but more than a third of all cancellations. Every later stage focuses on them first.
Decision point
If you can't tell who leaves and when, fix the data before anything else. Without it, every later stage is aimed at customers in general, and the fixes land on the wrong people.
Stage 2 of 5
Who is likely to leave next?
Tool: Net Promoter Score · Time: 2 to 3 weeks
Stage 1 shows who has already left. Net Promoter Score finds who is likely to leave next. It asks current customers one question: how likely are you to recommend us to a friend, from 0 to 10? Answers sort into three groups, and the score is the percentage of promoters minus the percentage of detractors.
The three Net Promoter Score groups
- +Promoters
- Score 9 or 10. Loyal, and likely to recommend you
- =Passives
- Score 7 or 8. Satisfied, but would switch for a better offer
- −Detractors
- Score 0 to 6. Unhappy, and the most likely to leave
The number matters less than the follow-up. Ask everyone one more question, "What is the main reason for your score?", and keep the detractors' answers. They are a list of what is going wrong, in the words of people who haven't left yet.
Time the survey to the hot spot. For new customers, ask a few weeks after they join, while the start of the experience is still fresh.
The score, worked for the newest customers
Net Promoter Score% promoters − % detractors
- Survey of customers in their first three months24% promoters, 30% passives, 46% detractors
- The score24 − 46 = −22. For customers of more than a year, it was +18
- What came nextDetractors in the survey canceled at four times the rate of promoters over the next quarter
Handed to stage 3: new customers score far lower than long-standing ones, and their detractors are the people to interview in stage 3.
Stage 3 of 5
Why do customers leave, in their own words?
Tool: Voice of the Customer · Time: 2 to 3 weeks
Now find out why. Voice of the Customer collects needs in the customer's own words, groups them, and ranks them. Talk to 15 to 20 people who canceled and 10 to 15 detractors from stage 2.
Price is the reason people give most often, because it is easy to say. Ask instead about the moment they decided: what happened just before you called to cancel? The answer is usually a specific event, and events can be fixed.
Three questions for people who left
The ruleAsk about the moment of deciding, not about the company in general
- Instead of "Why did you leave?"What happened just before you called to cancel?
- Instead of "Were you unhappy with us?"What did you try before deciding to leave?
- Instead of "Would a discount help?"What would have had to be different for you to stay?
| What they said | The need behind it | How many |
|---|---|---|
| My first bill was higher than the price I was sold | No surprises on the bill | 14 of 32 |
| The technician didn't come on the day | Installation when promised | 11 of 32 |
| The speed drops every evening | Steady speed | 9 of 32 |
| It took 40 minutes to reach anyone | Quick help when it goes wrong | 7 of 32 |
Handed to stage 4: four unmet needs, ranked. The first bill, not the monthly price, was the most common trigger. Customers had been told a price without the installation fee.
Decision point
If everyone says price, ask what happened just before they decided. A discount answers the stated reason and leaves the real one in place. Here, "too expensive" usually meant a first bill nobody had warned them about.
Stage 4 of 5
Where in the customer's experience do things break?
Tool: Customer Journey Mapping · Time: 1 week
Stage 3 says what goes wrong. A customer journey map shows where. It follows one kind of customer through their experience, step by step, in five layers. Map one kind of customer at a time; a map that tries to cover everyone covers no one well. The site's User Personas page explains how to define that customer.
The five layers of a customer journey map
- 1Stages
- The phases the customer moves through
- 2Touchpoints
- Where they meet the company in each one
- 3Actions
- What they do there
- 4Emotion
- How they feel, high or low
- 5Opportunities
- What could be done better
Map the stretch where stage 1 found the churn, and fill the emotion layer from what customers told you in stage 3, not from what the team believes. The low points are where people decide to leave, and the opportunities layer turns each one into something to fix.
| 1. Stages | Sign up | Installation | First week | First bill | Month 3 |
|---|---|---|---|---|---|
| 2. Touchpoints | Sales call | Technician visit | Router, website | Bill, call center | Evening use |
| 3. Actions | Chooses a plan | Waits at home | Sets up devices | Checks the amount | Streams, works |
| 4. Emotion | 4 | 1 | 3 | 1 | 2 |
| 5. Opportunities | State the full first bill | Text when the technician is on the way | – | Explain the fee on the bill | Fix evening speed |
Handed to stage 5: two low points, installation day and the first bill, and five possible fixes. The first bill fix starts at sign-up, two stages earlier, which nobody had spotted.
Stage 5 of 5
Which fixes come first?
Tool: Value vs Effort Matrix · Time: half a day
Now choose. The Value vs Effort Matrix plots each fix by how much it would reduce churn and how much work it takes, giving four quadrants: Quick Wins (high value, low effort), Major Projects (high value, high effort), Fill-Ins (low value, low effort) and Thankless Tasks (low value, high effort).
Judge value by the evidence from stages 1 to 4: how many leaving customers a fix would have kept. Do the quick wins at once, fund the major projects properly, and drop the thankless tasks, however appealing they look.
A rough count is enough. Quoting the full first bill addresses the most common trigger from stage 3, named by 14 of 32 customers, and costs a change to a sales script. That is a quick win by any measure.
Handed on: two quick wins started within the month, one network project funded, and the app rebuild set aside.
Pace
Fast track or thorough
The fast track suits a small business with a few hundred customers. The thorough run suits a large customer base, where a wrong guess about why people leave costs a great deal.
| Stage | Fast track (about two weeks) | Thorough (6 to 8 weeks) |
|---|---|---|
| 1. Churn data | A spreadsheet of last year's cancellations | Churn split by tenure, plan and region |
| 2. NPS | Ask the question on every support call | A survey of each customer group |
| 3. Voice of the Customer | Ten calls to recent leavers | 30 interviews, grouped into needs |
| 4. Journey map | Sketched on a whiteboard | Built with sales, field and support staff |
| 5. Value vs Effort | One team meeting | Value estimated from the churn data |
Failure modes
How churn reduction goes wrong
| What happens | What it looks like | The fix |
|---|---|---|
| Discounting first | Bigger offers for people who threaten to leave | Find out why they leave before paying them to stay |
| Averaging churn | One churn rate for everyone | Split it by tenure and group, as in stage 1 |
| Chasing the score | Teams push customers for high ratings | Use NPS to find reasons, not as a target |
| Believing "too expensive" | Price cuts that don't stop the leaving | Ask what happened just before they decided |
| Fixing what the team dislikes | An app rebuild nobody asked for | Rank fixes by the customers they would keep |
After the playbook
Checking that churn is falling
Track churn every month, split the same way as in stage 1. An overall churn rate can hide a fix that works for one group while another gets worse. For the internet provider, the measure that mattered was churn in the first three months, tracked as one of its KPIs, with a target of halving it within a year.
Repeat the NPS survey each quarter, and keep reading the detractors' reasons. When a new reason starts to appear, take it back through stages 3 to 5 before it shows up in the churn figures.
Common questions
Customer churn: quick answers
How do you calculate customer churn rate?
Divide the customers who canceled during a period by the customers you had at the start of it. Losing 5,400 of 180,000 customers in a month is a monthly churn rate of 3%. Work it out for each customer group too, because the overall rate hides where churn is concentrated.
What is customer churn?
The share of customers who cancel, or stop buying, in a given period. A provider with 180,000 subscribers losing 5,400 a month has a monthly churn rate of 3%. Churn matters because winning a new customer usually costs more than keeping an existing one.
How do you reduce customer churn?
Find where churn is concentrated in your own data, use Net Promoter Score to find who is likely to leave next, interview leavers and unhappy customers about what happened just before they decided, map where the experience breaks, and fix the problems that would keep the most customers first.
What is a good customer churn rate?
It depends on the industry and on what customers pay for. A useful comparison is your own churn over time, split by customer group, rather than an industry average. Churn that is falling for your newest customers is a better sign than any benchmark.
Is Net Promoter Score a good predictor of churn?
It is a useful early signal, especially when you compare groups: detractors usually cancel more often than promoters. Its greater value is the follow-up question about the reason for the score, which tells you what to fix.
Should you offer discounts to stop customers leaving?
Only after you know why they leave. A discount answers the reason people give, which is usually price, and leaves the real cause in place. It can also teach customers that threatening to leave earns a lower price.
Why do customers leave in the first few months?
Often because the start of the experience falls short of what they were promised: a delayed setup, a surprise on the first bill, or a product that is harder to use than it looked. These are usually cheaper to fix than problems later on.
Frameworks in this playbook
- Net Promoter ScoreStage 2: Who is likely to leave next?
- Voice of the CustomerStage 3: Why do customers leave, in their own words?
- Customer Journey MappingStage 4: Where in the customer's experience do things break?
- Value vs Effort MatrixStage 5: Which fixes come first?
- KPIsAfter: churn tracked monthly, by customer group