Voice of the Customer: How Many Interviews, and What to Do With Them
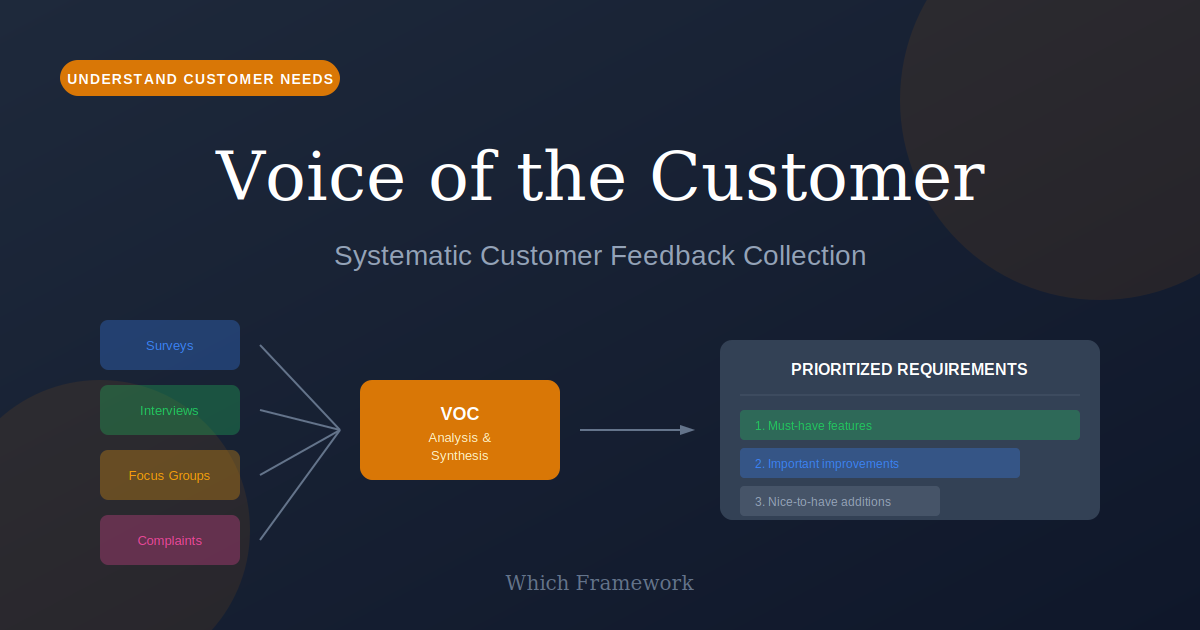
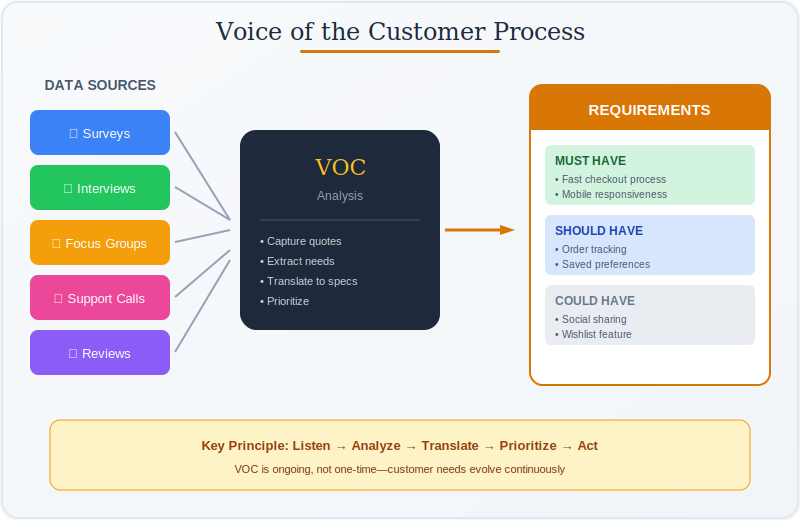
Voice of the Customer is a research method that identifies customer needs in the customer's own words, structures them into a hierarchy, and assigns priorities to them for use in design.
Before you start
Is this your framework?
Voice of the Customer answers one question: what do customers actually need, in their words, and which of those needs matter most. It produces a structured list, not a number and not a feature backlog.
It is discovery work, so it takes weeks and assumes the answer is not already known. If you have the list and need it ranked, or need to track sentiment, the table below points elsewhere.
| If your real problem is… | You probably want |
|---|---|
| We have the needs and want to know which are worth doing well | Kano Model — classifies features by how presence and absence affect satisfaction Compare Voice of the Customer and Kano |
| We want one number to watch sentiment over time | Net Promoter Score — a tracking metric, which discovers nothing Compare Voice of the Customer and NPS |
| We want to know what customers are trying to achieve, not what they ask for | Jobs to Be Done — underlying motivation rather than stated needs |
| We need to see where the existing experience breaks down | Customer Journey Mapping — the current experience, stage by stage |
| We have the needs and need a build order and a first release | User Story Mapping — structure and slicing, downstream of discovery |
| We need to know who our customers are before asking any of them anything | User Personas — segments, which determine who to interview |
| We are designing something and are not confident we know what customers need | Voice of the Customer — you are in the right place |
What Is It?
Interview customers, capture what they say they need in their own language, organize those statements into a structure, and work out which matter most. The output is a prioritized hierarchy of needs that a design team can work against without guessing.
The method came out of quality function deployment, where customer needs are the input to engineering decisions rather than an afterthought. That origin explains its character: it is rigorous about the difference between what a customer wants and how you might provide it, because the whole point is to hand engineers a problem rather than a pre-chosen solution.
Two questions dominate in practice, and the research answers both. How many customers do we have to interview, and how many people have to read the transcripts. Most teams over-invest in the first and under-invest in the second, which is exactly backwards.
Around twenty one-on-one interviews within a segment identify roughly nine needs in ten, and thirty gets you to about ninety-five per cent. The curve flattens fast. Beyond that point, a new segment is worth more than another interview in the old one, because the needs you are still missing are the ones held by people you have not spoken to.
The reading is the cheaper lever and the one that gets skipped. A single analyst working through the transcripts finds a fraction of what is there; several readers working independently and then merging find considerably more. Adding a second and third reader costs a day. Adding ten more interviews costs weeks.
Quick Reference
Sample size
How many interviews, and how many readers
Both numbers were modelled in the original research rather than guessed, which makes this one of the few places in customer research where a sample size has a defensible basis.
| Lever | What the research found | What to do about it |
|---|---|---|
| Number of interviews | Roughly 90% of a segment's needs surface by about twenty interviews, and 95% by thirty. Returns diminish sharply after that. | Budget twenty to thirty per segment. Do not let a study stall waiting for a fortieth interview that will add almost nothing. |
| Number of readers | Each transcript was read by seven analysts and the results merged. Any one analyst found substantially less than the merged set. | Have at least three people read independently, then merge. This is the cheapest quality improvement available to a VoC study. |
| Number of segments | Coverage is per segment. Needs held only by people you did not interview do not appear at any sample size. | Once a segment is saturated, spend the next interview on a different segment rather than the same one. |
The expensive lever is the one teams pull
Faced with doubt about a study's completeness, most teams book more interviews. That is the slow, costly response and it is aimed at the smaller of the two gaps. If twenty interviews already contain ninety per cent of the needs, the question worth asking is how much of that ninety per cent your analysis actually extracted — and with one person reading, the answer is well under all of it.
Worth being precise about what these numbers are. They are estimates from a model fitted to a particular study, not measurements that generalize to every market. Treat twenty to thirty as a well-founded planning figure rather than a rule, and treat the shape of the curve — steep, then flat — as the durable finding.
Analysis
Needs, solutions, and structuring what you find
What gets written down during an interview determines everything downstream. The recurring error is recording a solution and calling it a need.
| What was said | Recorded as a solution | Recorded as a need |
|---|---|---|
| "I can never find last month's invoice" | Add a search filter to the billing page | I can find a past invoice without asking anyone. The first has already chosen the answer; the second leaves the design open. |
| "The report takes forever to build" | Add scheduled report exports | I get the numbers I need without assembling them myself. |
| "I don't know if the order went through" | Send a confirmation email | I know an order has been accepted before I leave the page. |
| Level | What sits there | Roughly how many |
|---|---|---|
| Primary | The handful of broad needs that organize everything else. | Five to ten |
| Secondary | What each primary need means in practice. This is the level most design work happens at. | Twenty to forty |
| Tertiary | Specific detailed statements, close to the customer's own wording. | A hundred or more |
Let customers do the grouping
A team sorting needs into a hierarchy produces a structure that mirrors how the team thinks about the product. Customers sorting the same statements produce a different one, and it is the more useful of the two, because it reflects how the people you are designing for actually organize the problem. A card sort with a subset of interviewees costs little and is the step most often skipped.
Prioritization comes last, and it is a separate exercise from discovery. Asking customers to rate the importance of needs they have just helped articulate works well; asking them to rate a list they have never seen produces polite agreement with everything. The order matters more than the technique.
Core Features
- Open interviews, not surveys: the list of needs is not known in advance
- Twenty to thirty per segment: a planning figure with a basis behind it
- Several independent readers: then merged, because one reader misses a lot
- Needs in the customer's words: benefits, never implementations
- A three-level hierarchy: grouped by customers where possible
- Priorities assigned separately: after the needs exist, not during discovery
Worked example
Forty-six interviews, one segment, one reader
An illustrative composite. A veterinary practice management software company in Dublin, Ireland, planning a rebuild. The team had run 46 customer interviews over four months and the project had stalled: nobody could agree what the findings said.
| What was examined | What it showed |
|---|---|
| Who had been interviewed | All 46 were practice owners. Nobody had spoken to a veterinary nurse or a receptionist, who between them do most of the daily data entry. Forty-six interviews in one segment, none in the two segments that use the software most. |
| Who had read the transcripts | One product manager, working alone. Three colleagues re-read a sample of eight transcripts independently and found 31 needs the original pass had not recorded — from eight interviews. |
| What had been recorded | Of 112 logged items, 71 were phrased as features. "Bulk vaccination reminders" appeared as a need; the underlying statement was about chasing overdue boosters without a list. |
| How it was structured | Grouped by the team into the product's existing module names. A card sort with nine customers produced a different top level, organized around the working day rather than the software. |
| What changed | Twelve interviews with nurses and eight with receptionists. Three readers per transcript. Items rewritten as needs. Hierarchy rebuilt from the customer sort. Total additional effort: about five weeks. |
Forty-six interviews in one segment is twenty-six wasted
The study was well past saturation for practice owners by interview twenty and kept going for another twenty-six, while two segments that use the product daily went unasked. The effort was real and it was pointed at the wrong axis. Twenty interviews across three segments would have cost less and found more.
The re-reading result is the one worth remembering. Three colleagues re-reading eight existing transcripts found 31 unrecorded needs — from material already collected and paid for. The cheapest finding in the project came from reading what they already had. Nothing about that requires budget, access to customers, or permission.
When to Use
- Designing or rebuilding something and unsure what customers actually need
- The requirement list came from internal opinion rather than from customers
- Entering a market or segment you do not know well
- Different user groups may need genuinely different things
- There is time for interviews and analysis before design decisions land
- Engineers need a problem statement rather than a feature list
When NOT to Use
- The needs are already well understood and the question is which to build first
- A decision is due before interviews could be run and analyzed
- You cannot reach customers in the segments that matter
- What you need is a trackable number rather than a list of needs
- A recent study exists and the market has not moved since
- Nobody will act on findings that contradict the existing plan
Analysis
How VoC studies go wrong
The commonest failures are about who was asked and who read the answers, not about interview technique.
| Failure mode | What it looks like | What to do instead |
|---|---|---|
| One segment, many interviews | Forty interviews with buyers and none with the people who use the product daily | Saturate a segment at twenty to thirty, then move to the next one. Coverage is per segment. |
| One person reading | A single analyst extracts the needs, and a large share of what was said never gets recorded | Three readers minimum, independently, then merge. Cheapest quality gain in the method. |
| Solutions recorded as needs | The list reads like a feature backlog, and the design space was narrowed before design started | Rewrite each item as the benefit in the customer's words. Keep the original quote alongside. |
| Team-built hierarchy | Needs grouped by the product's existing modules, so the structure confirms what exists | Card sort with a subset of interviewees. Their grouping is the one you want. |
| Prioritizing during discovery | Importance judged as needs are collected, so early items get weighted by recency | Collect first, prioritize second, as a separate exercise with the full list visible. |
| Findings ignored | A thorough study, a full report, and a roadmap that did not change | Agree before starting what would change if the findings contradicted the plan. |
| Survey instead of interviews | A questionnaire asking about needs the team already thought of | Interview to discover, survey to prioritize. A survey cannot surface an unasked need. |
Sourced
Evidence, and how to cite it
The method has a specific source, and it is not Six Sigma.
Abbie Griffin and John Hauser published "The Voice of the Customer" in Marketing Science in 1993, addressing the voice-of-the-customer component of quality function deployment: identifying customer needs, structuring them into a hierarchy, and assigning priorities. QFD itself is older and Japanese in origin. The 1993 paper is what turned the idea into a method with answerable questions about sample size and analysis, and it is the correct citation for the technique as practiced.
Griffin, A. and Hauser, J.R. (1993) ‘The Voice of the Customer’, Marketing Science, 12(1), pp. 1–27.
Around twenty interviews find most of the needs in a segment.
Griffin and Hauser interviewed thirty potential customers of portable food-carrying products, then used a beta-binomial model to estimate what proportion of the total needs a given number of interviews would surface. The estimates are commonly summarized as roughly 90% of needs at twenty interviews and 95% at thirty. Two cautions belong with the number: these are modelled estimates from one study rather than measurements that generalize, and coverage is per segment, so needs held only by people you did not interview do not appear at any sample size.
Griffin and Hauser (1993), on the number of customers to interview.
One analyst reading the transcripts misses a great deal.
In the same study each interview transcript was read by seven analysts, and the needs each identified were merged. Any individual analyst recorded substantially fewer needs than the merged set, meaning a study analyzed by one person systematically under-reports what its own interviews contain. This is the finding least often quoted and the most useful, because adding readers is far cheaper than adding interviews. It also means the quality of a VoC study cannot be judged from its sample size alone.
Griffin and Hauser (1993), on the number of analysts required to read transcripts.
Customers and teams build different hierarchies.
The paper also examined how customer needs should be structured, comparing groupings produced by customers with those produced by a team reaching consensus. The two differ, and they differ in ways that matter for design, since the structure determines which needs get considered together. The customer-generated grouping reflects how the people you are designing for organize the problem, which is generally what you want. The team version tends to reproduce the existing product architecture.
Griffin and Hauser (1993), on structuring customer needs.
How to cite it.
Harvard: Griffin, A. and Hauser, J.R. (1993) ‘The Voice of the Customer’, Marketing Science, 12(1), pp. 1–27.
APA: Griffin, A., & Hauser, J. R. (1993). The voice of the customer. Marketing Science, 12(1), 1–27.
If you quote the sample size, say that it is a modelled estimate and that coverage is per segment. Both qualifications are in the paper and both are routinely dropped.
Key Strengths
- Discovers needs nobody asked about: which a survey structurally cannot
- A defensible sample size: rare in customer research
- Hands engineers a problem: not a pre-chosen solution
- Structure that reflects customers: if you let them do the grouping
- Cheap to improve: more readers costs a day and recovers a lot
Key Weaknesses
- Slow: weeks of interviews and analysis before anything is decided
- Coverage is per segment: and missing a segment is invisible in the results
- Analysis quality is unobservable: a thin read looks like a thorough one
- Captures stated needs: not unarticulated ones or future ones
- Easy to ignore: a report that contradicts the plan often loses
Sequencing
What to run before and after
VoC produces a list of needs. Deciding who to ask comes before it, and everything about what to build comes after.
Before
Work out who the segments are, because coverage is per segment
Interviewing forty people from one group leaves the needs of every other group entirely absent, and nothing in the results will show that. Knowing the segments is a precondition, not a refinement.
During
Place the needs against the experience they belong to
Needs mean more when you can see where in the customer's day they arise. Mapping them onto the journey also exposes stages nobody mentioned, which is usually a sampling gap.
After
Decide which needs are worth meeting well, then what ships first
A prioritized list of needs is still not a plan. Some are expectations where adequate is the target, and the rest have to be turned into an order and a release.
Common questions
Voice of the Customer: quick answers
What is Voice of the Customer?
A structured way of finding out what customers need, stated in their words rather than as product features, and then organizing and prioritizing those needs so they can be designed against. It came out of quality function deployment, where customer needs form the input to engineering decisions.
How many customer interviews do you need?
Fewer than most teams assume. The research behind VoC modelled this directly and estimated that around 20 one-on-one interviews identify roughly 90% of the needs in a segment, and 30 get you to about 95%. The curve flattens quickly, so the twentieth interview is worth far less than the fifth. Interview a new segment rather than adding a fortieth interview to the same one.
Why does more than one person need to read the transcripts?
Because a single reader misses a substantial share of the needs present. The original study had seven analysts read each transcript and then merged what they found, and the merged set was considerably larger than any individual's. This is the cheaper of the two levers: adding a second and third reader costs almost nothing next to running more interviews, and recovers more.
What is the difference between a need and a solution?
A need describes the benefit a customer wants in their own words. A solution describes how you would deliver it. "I want to find last month's invoice without calling anyone" is a need. "Add a search filter" is a solution. Recording solutions is the commonest way a VoC study narrows the design space before anyone has looked at it.
How do you structure the needs once you have them?
Group them into a hierarchy: a small number of primary needs, each containing secondary needs, each containing specific tertiary ones. The grouping should be done by customers where possible rather than by the team, because the two produce different structures and the customer one reflects how they actually think about the problem.
Is Voice of the Customer the same as a survey?
No. Surveys are good at measuring how strongly a known need is felt, and poor at discovering needs nobody has thought to ask about. VoC starts with open interviews precisely because the list of needs is not known in advance. Surveys have a place later, for prioritizing what the interviews found.
What is the difference between VoC and NPS?
NPS measures sentiment with one question and produces a number. VoC discovers what customers need and produces a structured, prioritized list. They answer different questions: one tells you something changed, the other tells you what to build. The free-text comments in an NPS survey are a thin form of VoC, and are usually the most useful part of it.
How do you cite Voice of the Customer?
Cite Griffin, A. and Hauser, J.R. (1993) 'The Voice of the Customer', Marketing Science, 12(1), pp. 1-27. That is the paper that gave the method its name and addressed how many customers to interview and how many analysts should read the transcripts. It sits within quality function deployment, which predates it.
Deep Resources
Frameworks related to Voice of the Customer
- Kano ModelWhich of the needs you found are worth meeting well, and which only have to exist…
- Net Promoter ScoreA sentiment number, where this produces a structured list of needs…
- Customer Journey MappingWhere in the customer's day each need arises, and which stages nobody mentioned…