Net Promoter Score: How NPS Is Calculated, and What It Does Not Predict
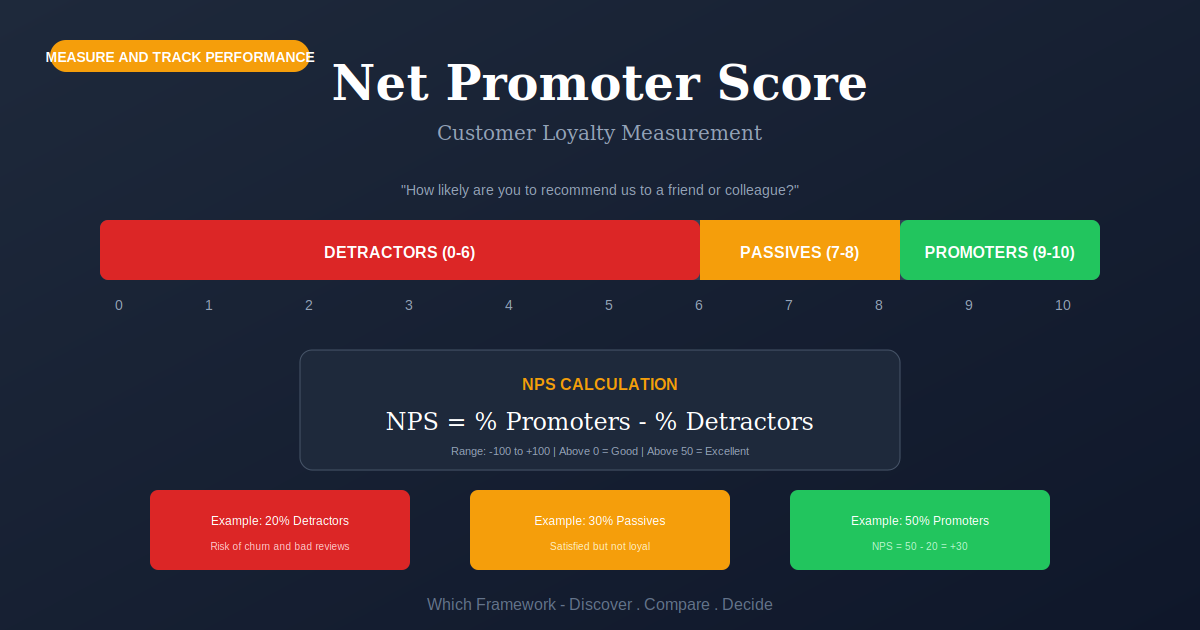
Net Promoter Score is a loyalty metric derived from a single recommendation question, sorting respondents into promoters, passives and detractors and reporting the percentage of promoters minus the percentage of detractors.
Before you start
Is this your framework?
NPS answers one question: is sentiment toward us moving, and in which direction. It is a tracking metric. Measured the same way every quarter, a change in it is worth investigating.
What it cannot tell you is what to do. A score of 34 carries no information about which part of the product is failing, and no amount of segmenting the number will produce that. The table below says what will.
| If your real problem is… | You probably want |
|---|---|
| We need to know which features are worth building well and which merely have to exist | Kano Model — classifies features by how presence and absence affect satisfaction Compare NPS and Kano |
| We need to gather and structure what customers actually need | Voice of the Customer — collecting needs properly, and how many interviews it takes Compare NPS and Voice of the Customer |
| We want to find where the current experience breaks down | Customer Journey Mapping — the stages where dissatisfaction is created |
| We are choosing which measures the business reports on at all | Key Performance Indicators — selecting and owning measures, of which this is one |
| We need to know what customers are trying to achieve | Jobs to Be Done — motivation rather than sentiment |
| We want to know how we compare with competitors on the things buyers weigh | Competitive Positioning Map — relative position on real attributes |
| We need one comparable number to watch over time, and we know its limits | Net Promoter Score — you are in the right place |
What Is It?
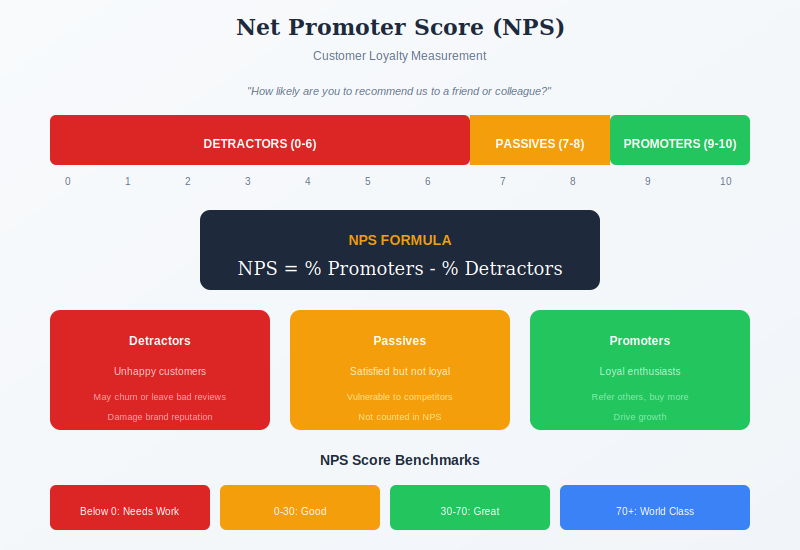
Ask one question — how likely are you to recommend us, on a scale of 0 to 10 — then sort the answers into three bands and subtract one share from another. That is the whole method, and its brevity is the reason it spread faster than any comparable measure.
The appeal is real. One question gets answered when a twenty-question survey does not. One number can be tracked, compared across teams and put on a slide. And the recommendation question is a reasonable proxy for something businesses care about, because a customer who would recommend you is usually a customer who intends to stay.
The original claim went considerably further than that. NPS was introduced as the single number that best predicts growth, better than satisfaction or retention measures. That is a strong, testable assertion, and it was tested. It did not hold.
Knowing this does not make the metric useless, and the page is not an argument for dropping it. It changes what you should say about it: NPS is a defensible way to track sentiment over time and a poor basis for claiming a number predicts revenue. The gap between those two statements is where most NPS programs get into trouble, usually at the point the score enters somebody's bonus.
The most useful thing in an NPS survey is also the part most often ignored. The free-text box asking why produces the information you can act on. The number tells you something changed; the comments tell you what.
Quick Reference
The calculation
The arithmetic, and what it discards
The calculation is simple enough to do in your head, and simple in a way that throws information away deliberately.
| Band | Answers | How it counts, and what that hides |
|---|---|---|
| Detractors | 0 to 6 | Subtracted. Six of the eleven possible answers land here, so someone mildly lukewarm at 6 is counted identically to someone actively hostile at 0. |
| Passives | 7 and 8 | Counted in the base and nowhere else. A company whose customers all answer 8 scores zero, which is also what a company split evenly between 10s and 3s scores. |
| Promoters | 9 and 10 | Added. Only two answers qualify, which is why scores look low against intuition and why small shifts move the number a lot. |
Two very different customer bases can produce the same score
Everyone answering 8 gives a score of zero. A base split half at 10 and half at 3 also gives a score of zero. One of those companies has a solid, unexcited customer base and the other has a civil war, and the headline number cannot tell them apart. Reporting the three band percentages alongside the score costs nothing and prevents exactly this.
The other consequence of the cut points is volatility. With only two promoter answers, a handful of respondents moving from 9 to 8 shifts the score noticeably without anything meaningful having changed. On small samples this produces quarter-to-quarter movement that gets explained in board meetings as though it were signal. Publish the sample size next to the score, always.
The evidence
The growth claim, and what happened to it
The metric arrived with an unusually strong claim attached, and the subsequent history is worth knowing before quoting it.
| When | What was said | What it means for you |
|---|---|---|
| 2003 | NPS introduced as the single best predictor of company growth, superior to satisfaction and retention measures. | This is the claim most articles still repeat, usually without the qualification that followed. |
| 2007 | An independent replication using 21 firms and over 15,500 interviews failed to reproduce the superiority, including in the industries named as exemplars. | NPS correlates with growth. So do the alternatives it was said to beat. The distinctive claim is the one that did not survive. |
| 2021 | Bain introduced a second metric, the earned growth rate, stating that unaudited self-reported scores had been gamed and misused in ways that damaged NPS's credibility. | The clearest available acknowledgement of the limitation, from the people who created the metric. |
What survives, and what to stop saying
What survives is worth having. A single question gets high response rates, the bands are easy to explain, and a consistently measured trend is a real signal about sentiment. Stop saying it predicts growth better than the alternatives, because that specific claim was tested and did not replicate, and anyone who checks will find that in one search.
The 2021 development is the more interesting one for practitioners. The reason given for adding a second metric was not that the maths was wrong but that self-reported scores get gamed. That is a statement about incentives rather than statistics, and it points at the single change most likely to improve your own program: take the score out of anybody's compensation.
Core Features
- One question: likelihood to recommend, 0 to 10
- Three bands: detractors 0-6, passives 7-8, promoters 9-10
- A difference of percentages: promoters minus detractors, from -100 to +100
- A free-text follow-up: the part that carries the actionable information
- Consistent timing and sampling: or the trend measures the survey, not the customers
- Sample size published alongside: because small samples move the score a lot
Worked example
The score rose 27 points and churn never moved
An illustrative composite. A telecoms provider in Lisbon, Portugal, with about 900,000 consumer accounts. Reported NPS had climbed from 11 to 38 over six quarters, and the customer team was being congratulated. Churn had not moved.
| What was examined | What it showed |
|---|---|
| Who was being surveyed | Field engineers triggered the survey manually after a visit. Survey volume from engineers with the highest personal scores was four times that of their colleagues. Nobody had instructed this; the score was in a team bonus. |
| When it was sent | Median delay between a resolved fault and the survey had fallen from 6 days to under 2 hours across the six quarters. Same customers, different moment, different answer. |
| The bands underneath | Only the headline was reported. Promoters had risen from 31% to 44%; detractors had fallen from 20% to 6%. Passives had barely moved, which is not what a genuine improvement in a large base usually looks like. |
| The comments | Roughly 14,000 free-text responses had been collected over the period and never read. A sample of 400 found the most common theme, billing clarity, was almost absent from the post-visit surveys, because those customers had just had a good visit. |
| What changed | Survey triggering automated on a fixed rule and removed from engineer control. NPS taken out of the bonus. Bands and sample size reported alongside the score. Comments coded monthly. Reported NPS fell to 19 the following quarter. |
The score rose 27 points and nothing improved
Every step of the rise was defensible in isolation. Surveying sooner after a resolved fault is reasonable. Engineers who get good feedback sending more surveys is not obviously wrong. Nobody falsified anything, and the number still stopped describing the customer base, because it was attached to a bonus and the sampling was controlled by the people being measured.
The 14,000 unread comments are the more ordinary failure. The organization had spent six quarters collecting the one part of the instrument that says what to fix, and reading none of it, while reporting the one part that cannot. Churn was flat throughout, which was the honest signal all along and was available without any survey at all.
When to Use
- You need one comparable number to track sentiment over time
- Response rates matter and a long survey would not get answered
- The measure can be kept out of anybody's compensation
- Sampling and timing can be automated rather than left to staff
- Somebody will actually read the free-text responses
- You have enough respondents that quarterly movement is not noise
When NOT to Use
- You need to know what to fix, which the number cannot tell you
- The score would be attached to a bonus or a team target
- Staff can choose who gets surveyed or when
- Samples are small enough that the score swings on a few responses
- You intend to compare against published benchmarks from other industries
- The claim being made is that it predicts revenue
The evidence
How NPS programs go wrong
Nearly every one of these is a sampling or incentive problem rather than a problem with the arithmetic.
| Failure mode | What it looks like | What to do instead |
|---|---|---|
| The score is in a bonus | It rises steadily while churn, complaints and revenue do not move | Take it out. This is the single change that most improves an NPS program, and Bain's own 2021 position supports it. |
| Staff control the sampling | Survey volume concentrates among the people with the best personal scores | Automate triggering on a fixed rule. Nobody being measured should choose who is asked. |
| Timing drifts | Surveys sent sooner after good interactions than they used to be, so the trend measures the timing | Fix the point in the relationship at which the survey is sent, and keep it there. |
| Only the headline is reported | Two very different customer bases produce the same number and nobody can tell | Publish the three band percentages and the sample size next to the score, always. |
| Comments never read | Thousands of free-text responses collected, none coded, and the team still asking what to fix | Code a sample monthly. This is where the actionable content is; the number is a thermometer. |
| Benchmark comparison | A score compared against another industry, country or survey method as though it were like for like | Compare against your own history, measured identically. Cross-company comparison is rarely valid. |
| Overclaiming | The metric presented as predicting growth, a claim that failed replication in 2007 | Describe it as a sentiment trend. It is defensible as that and indefensible as a predictor. |
Sourced
Evidence, and how to cite it
The metric and its original claim are precisely dated.
Frederick Reichheld, a partner at Bain and Company, introduced the measure in "The One Number You Need to Grow" in the Harvard Business Review in December 2003, arguing that willingness to recommend was the loyalty question most strongly linked to company growth, and more useful than the multi-question satisfaction surveys then in use. Net Promoter and NPS are registered marks of Bain and Company, Satmetrix Systems and Fred Reichheld, which is worth knowing if you are publishing about it.
Reichheld, F.F. (2003) ‘The One Number You Need to Grow’, Harvard Business Review, December.
The superiority claim failed independent replication.
Keiningham, Cooil, Andreassen and Aksoy set out to reproduce the Net Promoter analyses using longitudinal data from 21 firms and more than 15,500 interviews from the Norwegian Customer Satisfaction Barometer, comparing the results against the American Customer Satisfaction Index. Using the industries Reichheld had cited as exemplars, they were unable to replicate his assertions about the clear superiority of Net Promoter over other measures. The finding is not that NPS is unrelated to growth. It is that the specific claim distinguishing it from the alternatives did not hold up.
Keiningham, T.L., Cooil, B., Andreassen, T.W. and Aksoy, L. (2007) ‘A Longitudinal Examination of Net Promoter and Firm Revenue Growth’, Journal of Marketing, 71(3), pp. 39–51.
Bain added a second metric in 2021, and said why.
Reichheld, with Darci Darnell and Maureen Burns, published "Net Promoter 3.0" in the Harvard Business Review in November 2021, introducing the earned growth rate: revenue growth attributable to returning customers and their referrals, drawn from accounting data. The stated reason was that as NPS spread, unaudited and self-reported scores were gamed and misused in ways that undermined the metric's usefulness. It is unusual for a metric's originators to publish that assessment, and it is the strongest available evidence that the gaming problem is structural rather than a matter of poor implementation.
Reichheld, F., Darnell, D. and Burns, M. (2021) ‘Net Promoter 3.0’, Harvard Business Review, November–December.
The band cut points discard a great deal of information.
Eleven possible answers are collapsed into three groups and then into one number, and the grouping is asymmetric: six answers are detractors, two are passives, two are promoters. A respondent answering 6 counts identically to one answering 0. Two organizations with entirely different distributions can report the same score, since a base answering uniformly 8 and a base split between 10s and 3s both produce zero. Reporting the band percentages alongside the score recovers most of what the arithmetic throws away, and costs nothing.
Direct property of the NPS calculation as defined; see also methodological critiques in the customer satisfaction literature.
How to cite it.
Harvard: Reichheld, F.F. (2003) ‘The One Number You Need to Grow’, Harvard Business Review, 81(12), pp. 46–54.
APA: Reichheld, F. F. (2003). The one number you need to grow. Harvard Business Review, 81(12), 46–54.
If you cite the growth claim, cite Keiningham et al. (2007) alongside it. For the later metric, cite Reichheld, Darnell and Burns (2021).
Key Strengths
- One question gets answered: response rates a long survey never reaches
- Comparable over time: a consistently measured trend is a real signal
- Understood everywhere: no explanation needed in a board pack
- Cheap: one question and a free-text box
- The comments are genuinely useful: if anybody reads them
Key Weaknesses
- Says nothing about what to fix: a thermometer, not a diagnosis
- Easy to game through sampling: without falsifying a single answer
- Discards the distribution: very different bases produce identical scores
- Volatile on small samples: two promoter answers make it twitchy
- The growth claim did not replicate: and is still widely repeated
Sequencing
What to run before and after
The score tells you that something moved. Everything about what and why comes from elsewhere.
Before
Decide what you are measuring and who owns it
A metric with no owner and no threshold is a number on a slide. Deciding in advance what movement would trigger what action is the difference between tracking and reporting.
During
Read the comments, and find where the experience breaks
The free-text answers are the actionable half of the instrument. Mapping the recurring themes onto the journey turns a sentiment number into a list of places to look.
After
Work out which fixes are worth making well
Detractor themes are not equally worth solving. Some are must-be features where adequate is the target, and knowing which is which stops you over-building an expectation.
Common questions
Net Promoter Score: quick answers
What is Net Promoter Score?
A loyalty metric built from one question: how likely are you to recommend us, answered from 0 to 10. Answers of 9 or 10 are promoters, 7 or 8 are passives, and 0 to 6 are detractors. The score is the percentage of promoters minus the percentage of detractors, giving a number between -100 and +100.
How is NPS calculated?
Take the share of respondents who answered 9 or 10, subtract the share who answered 0 to 6, and drop the percentage sign. Passives are counted in the base but contribute nothing to either side. If 50% are promoters and 20% detractors, the score is 30. It is a difference of percentages, not an average, so it is not a percentage itself.
What is a good NPS?
There is no defensible universal answer, which is why the published benchmarks vary so widely. Scores depend on industry, survey timing, channel, and country: several studies find respondents in some cultures systematically avoid extreme answers, which shifts the score without any difference in loyalty. Your own trend, measured the same way each time, is worth far more than a comparison against someone else's number.
Does NPS actually predict growth?
The original claim was that it is the single best predictor of growth. That claim was tested and did not hold. A 2007 study in the Journal of Marketing replicated the analysis using 21 firms and more than 15,500 interviews, and failed to reproduce the superiority of NPS over other loyalty measures, including in the industries cited as its exemplars. NPS correlates with growth; so do the alternatives.
Why does the 0 to 6 band count as detractors?
The cut points are a convention rather than a finding. Six of the eleven possible answers are detractors and only two are promoters, so the scale is deliberately unforgiving. It also means someone who answers 6 and someone who answers 0 are counted identically, which is a large amount of discarded information.
What is the earned growth rate?
A second metric introduced by Reichheld and colleagues at Bain in 2021, measuring revenue growth from returning customers and their referrals. It was proposed explicitly because self-reported, unaudited NPS had been gamed and misused in ways that damaged its credibility. It draws on accounting data rather than survey answers, which is harder to collect and harder to inflate.
How do you stop NPS being gamed?
Separate it from anybody's pay, which is the single biggest cause. Do not let staff choose who gets surveyed or when. Send it at a consistent point in the relationship rather than after a good interaction. And read the free-text comments, which is where the usable information is; the number itself tells you almost nothing about what to change.
How do you cite NPS?
For the metric, cite Reichheld, F.F. (2003) 'The One Number You Need to Grow', Harvard Business Review, December. For the failed replication, cite Keiningham, T.L., Cooil, B., Andreassen, T.W. and Aksoy, L. (2007) in the Journal of Marketing, 71(3). For the later metric, cite Reichheld, Darnell and Burns (2021) 'Net Promoter 3.0'. Net Promoter and NPS are registered marks of Bain, Satmetrix and Reichheld.
Deep Resources
Frameworks related to Net Promoter Score
- Voice of the CustomerGathering and structuring what customers need, which a score cannot supply…
- Kano ModelWhich features are worth doing well, and which only have to exist…
- Key Performance IndicatorsChoosing measures and giving each a target and an owner…