FreeNo sign-upYour figures stay on your computer
Error Reduction Tool
Before adding another check, find out where the errors come from. Measure the defect rate with one definition for each kind of error, find the path through the process that carries them, test each suspected cause against your data, then fix the proven ones where the work is done, give the whole process one owner, and keep improvements coming. Six stages, ending with a monthly defect rate and a full report.
The tour runs all six stages on an example medicine distributor whose pharmacies complained of wrong items and short-dated stock. Nothing in it touches your own work. Stages 1 to 3 take four to eight weeks, mostly gathering records and testing causes, and 5S about a week per work area. Stages 5 and 6 start during stage 4, then keep going: suggestions every week, the defect rate every month.
Six stages, in order
Each stage asks one question and hands its answer to the next. You can stop after any stage: save your progress file, and pick up later on any computer. The errors and defects playbook explains the method behind each one.
-
Stage 1 of 6 · Six Sigma
How often do errors happen, and what do they cost?
2 to 3 weeks
- You bring
- A month or more of error records, complaints and returns: a count of each kind of error, how many units you handled, and which errors customers found.
- You get
- Defects per million chances and the sigma level, by type, what the errors cost, and the share customers find. Counts that two people wouldn't agree on are sent back first.
How Six Sigma metrics worksUse the Six Sigma Calculator on its own
-
Stage 2 of 6 · Process mining
Where in the process do errors start?
2 to 4 weeks
- You bring
- Three months of event records from your system: one row per event, with the item, the activity and its time. Or the paths written out by hand.
- You get
- Every path the work really took, each one's error rate against the rest, the steps linked to errors, and the workarounds nobody planned.
How process mining worksUse the Process Mining Tool on its own
-
Stage 3 of 6 · Root cause analysis
Why do errors happen there?
2 to 4 weeks
- You bring
- The suspected causes, and the data to test each: the items it touches and how many went wrong, against the rest.
- You get
- Each cause proven, minor or ruled out, the fixes that fix none of them sent back, and where each proven cause goes next: the work area or another department.
How DMAIC worksUse the DMAIC Root Cause Analysis Tool on its own
-
Stage 4 of 6 · 5S
How do you make the right way the easy way?
About a week per area
- You bring
- The people who work in each area, and the error measure for it before you start.
- You get
- What changed at each of the five steps, a mistake-proofed step, the doorway test, a weekly audit score with its history, and the errors before and after.
-
Stage 5 of 6 · Business process management
Who owns the whole process, across every department?
2 to 3 weeks
- You bring
- Every department the process crosses, what each is measured on, and a senior person who can change those targets.
- You get
- The chain from request to satisfaction, the targets that reward sending errors on with a rule for each, one named owner, and one measure reviewed every month.
How business process management worksUse the Business Process Management Tool on its own
-
Stage 6 of 6 · Kaizen
How do errors keep falling after the project ends?
Every week
- You bring
- Every improvement suggestion, with the dates raised and answered, and each month's units and errors counted the same way as in stage 1.
- You get
- Which suggestions wait past a week, the defect rate month by month, and when it stops falling, the sign to run stages 2 and 3 again.
What you finish with
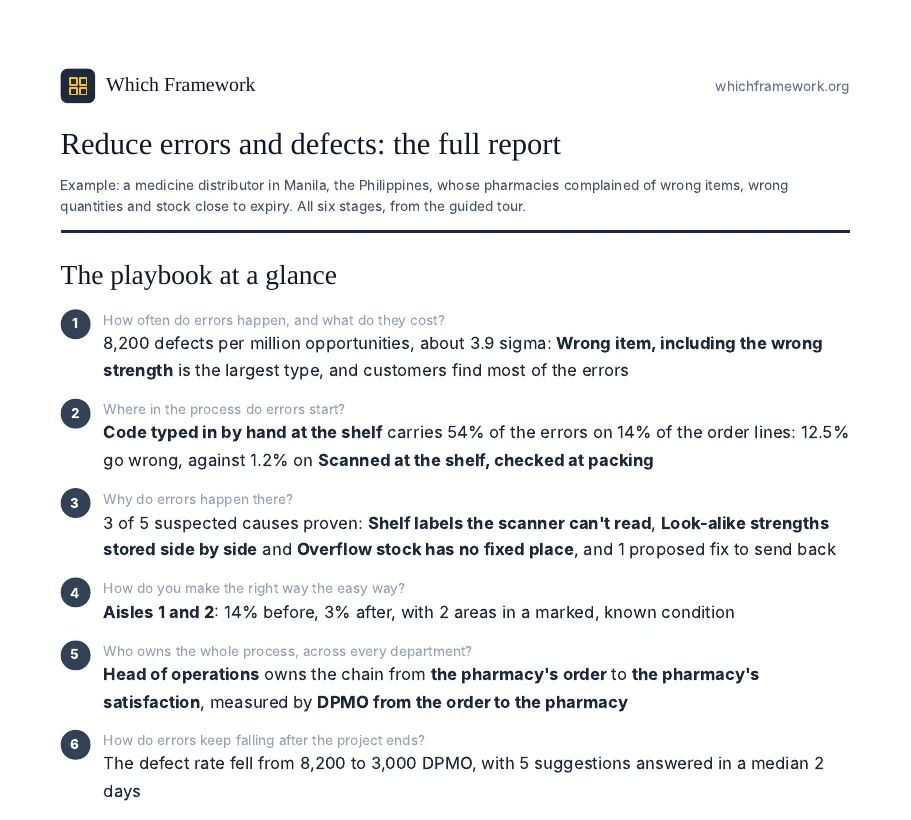
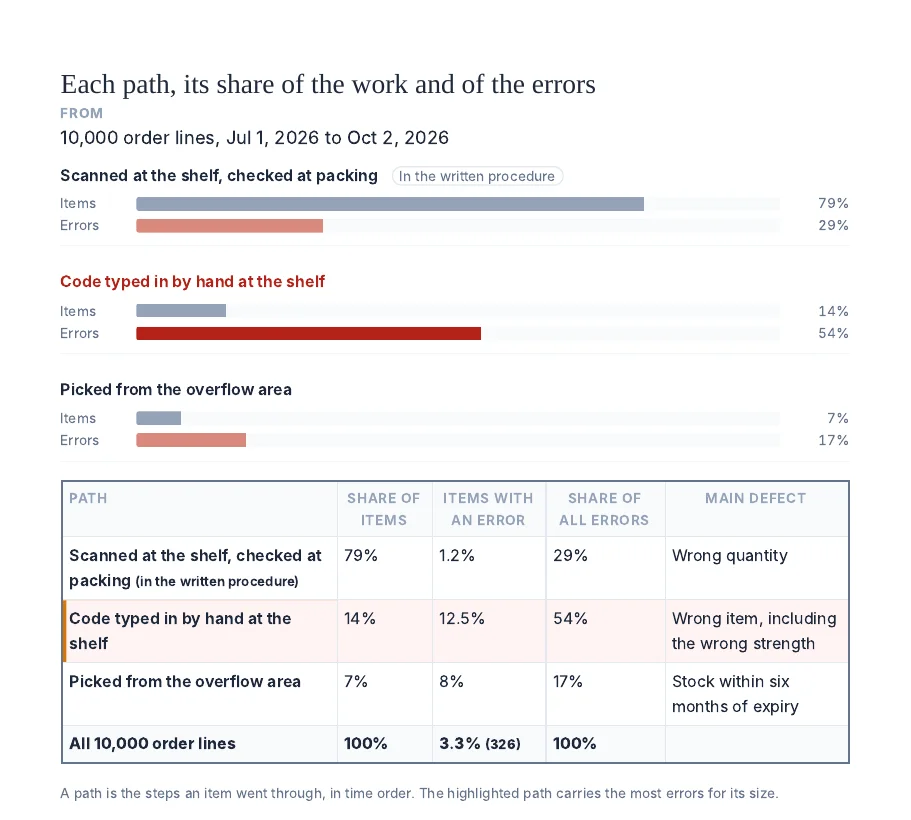
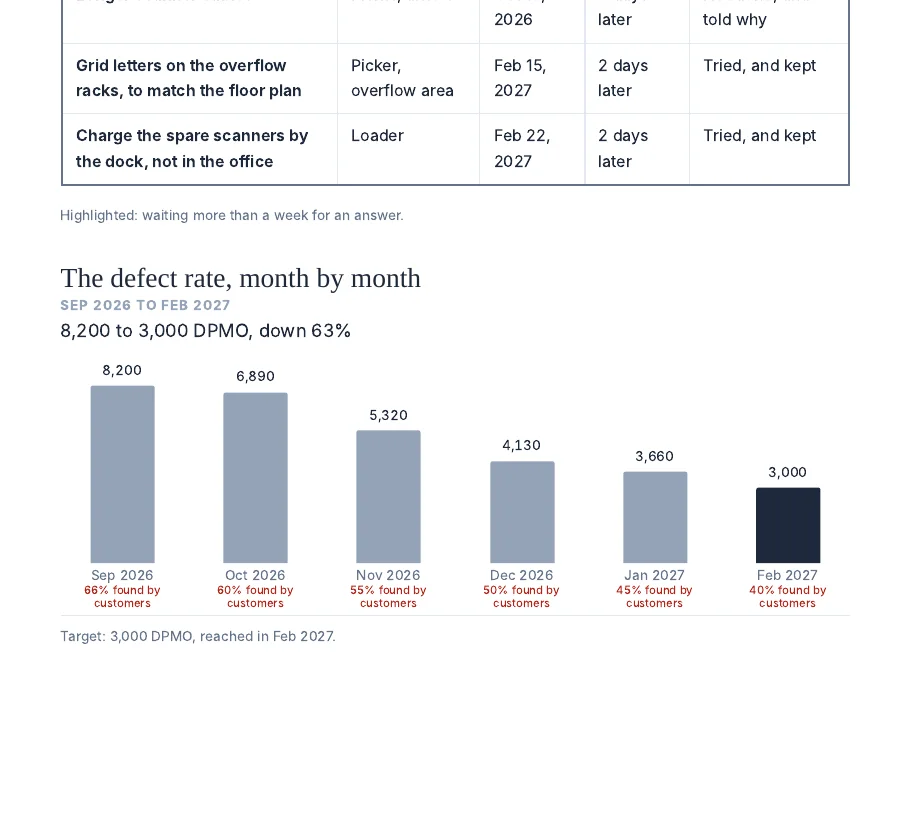
From the guided tour: a medicine distributor in Manila, the Philippines, whose pharmacies complained of wrong items, wrong quantities and stock close to expiry.
Download the example report (PDF, 19 pages)A PDF report of the whole playbook. One headline for each stage, as in the example, then each stage's full results: the charts, the tables and the diagnosis, with what it means and what to do next. It ends with the suggestions and the defect rate month by month.
A progress file you keep. An Excel workbook with a sheet for every stage, updated each time you save. Choose it on this page or on any stage, and the playbook reopens where you left off. Reopen it each week to log suggestions, and each month to add the counts.
Checks along the way. Counts two people wouldn't agree on are sent back before anything is measured; a fix that fixes no proven cause, such as one more check on every order, is sent back; causes still untested hold the stage; a process with no single owner, or an owner who can't change other departments' targets, is stopped; and a suggestion waiting past a week is flagged.
Questions
Is it free?
Yes. There is no sign-up. The PDF report asks for an email address; everything else works without one.
Where do my figures go?
Error counts, event logs, causes and suggestions stay in your browser and in the progress file you download. The event log is read in your browser and never uploaded. To write each stage's diagnosis, the page sends our server only figures and the places of items in your lists, never the names or the words.
Do I have to do all six stages?
No. Each stage also works on its own, from the tools page. If you already report a defect rate, start at stage 2. When no proven cause sits in a work area, the playbook skips 5S; when one team owns the whole process, it can skip stage 5.
Can several people work on it?
Yes, by passing the progress file. Save it after a stage, send it to a colleague, and they choose it on this page to carry on from there.
How is this different from the playbook article?
The article explains the method and follows one company through it. The tool runs the same six stages on your own records, and writes the diagnosis at each one.